Are you looking for love in New Jersey?
Or are you just hoping to hook up with a hot New Jerseyan?
Either way, we’ve got you covered here.
If you live in New Jersey, there’s a pretty good chance there are a lot of singles in your area. The Garden State has plenty of people over 18 who aren’t married or in a serious relationship.
That’s great news for people who are single and looking to mingle.
So, where are the best cities for singles in New Jersey? We used Saturday Night Science to find out.
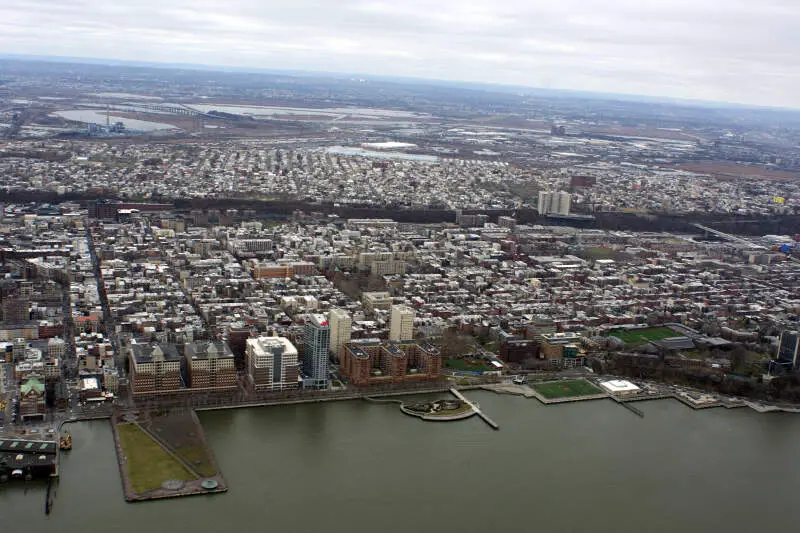
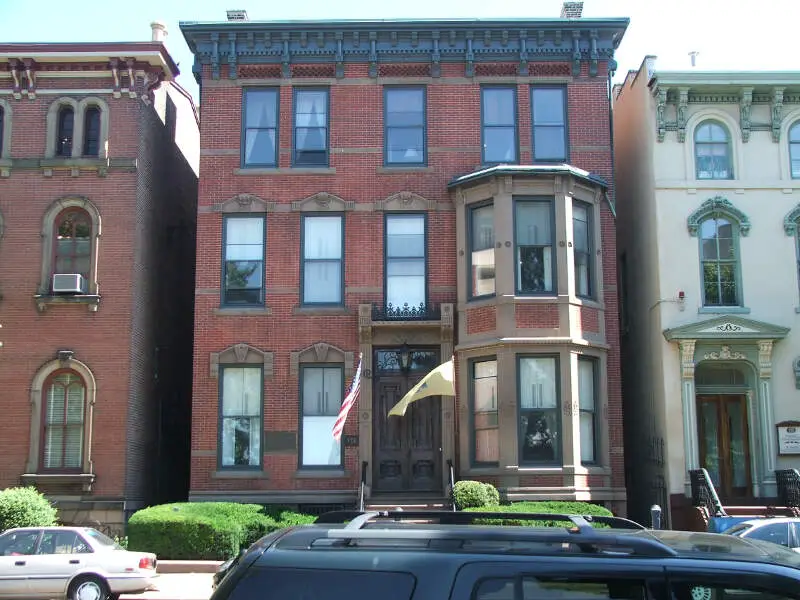
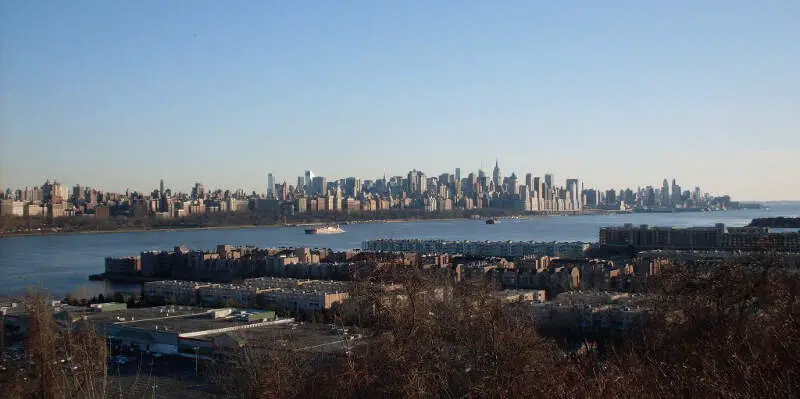
31.9 median age · 10.0% married households
Hoboken is a city in Hudson County, New Jersey, United States. As of the 2010 United States Census, the city’s population was 50,005, having grown by 11,428 from 38,577 counted in the 2000 Census, which had in turn increased by 5,180 from the 33,397 in the 1990 Census. Hoboken is part of the New York metropolitan area and is the site of Hoboken Terminal, a major transportation hub for the region.
Data | Crime | Cost of living | Movers
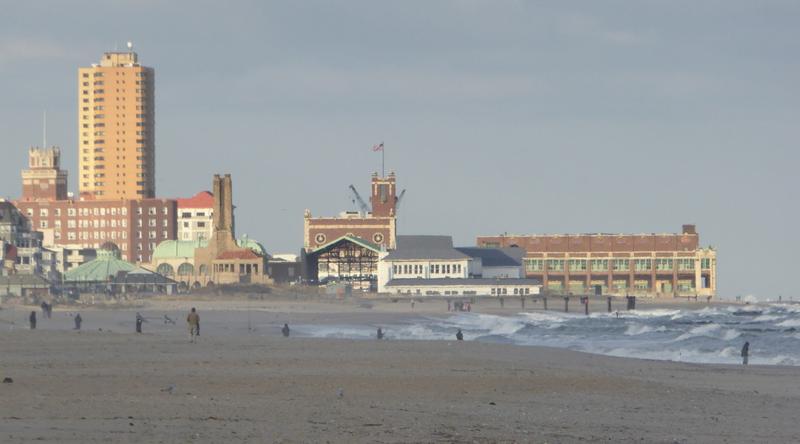
38.2 median age · 13.0% married households
Asbury Park is a city in Monmouth County, New Jersey, United States, located on the Jersey Shore and part of the New York City Metropolitan Area. As of the 2010 United States Census, the city’s population was 16,116, reflecting a decline of 814 from the 16,930 counted in the 2000 Census, which had in turn increased by 131 from the 16,799 counted in the 1990 Census.
Data | Crime | Cost of living | Movers
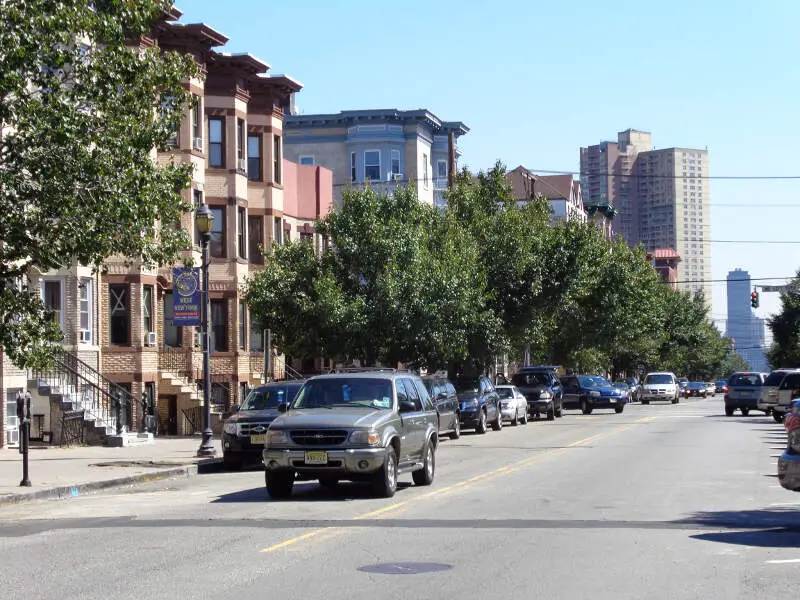
37.2 median age · 3.0% married households
West New York is a town in Hudson County, New Jersey, United States, situated upon the New Jersey Palisades. As of the 2010 United States Census, the town’s population was 49,708, reflecting an increase of 3,940 from the 45,768 counted in the 2000 Census, which had in turn increased by 7,643 from the 38,125 counted in the 1990 Census.
Data | Crime | Cost of living | Movers
35.2 median age · 9.0% married households
Highland Park is a borough in Middlesex County, New Jersey, United States. As of the 2010 United States Census, the borough’s population was 13,982, reflecting a decline of 17 from the 13,999 counted in the 2000 Census, which had in turn increased by 720 from the 13,279 counted in the 1990 Census.
Data | Crime | Cost of living | Movers
34.8 median age · 7.0% married households
Trenton is the capital city of the U.S. state of New Jersey and the county seat of Mercer County. It was briefly the capital of the United States. The city’s metropolitan area is grouped with the New York metropolitan area by the United States Census Bureau, but directly borders the Philadelphia metropolitan area and is part of the Federal Communications Commission’s Philadelphia Designated Market Area. As of the 2010 United States Census, Trenton had a population of 84,913, making it the state’s 10th-largest municipality. The Census Bureau estimated that the city’s population was 84,034 in 2014.
Data | Crime | Cost of living | Movers
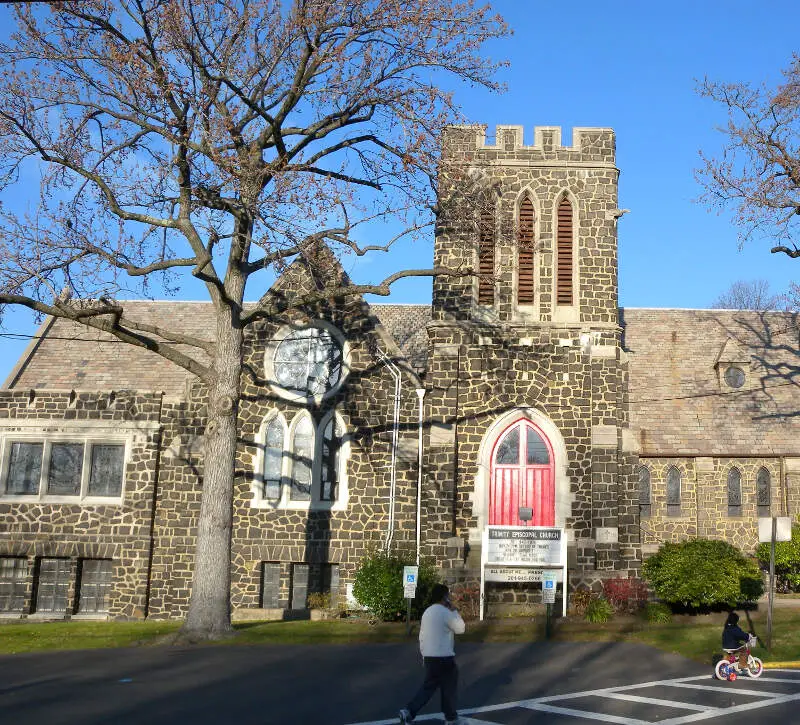
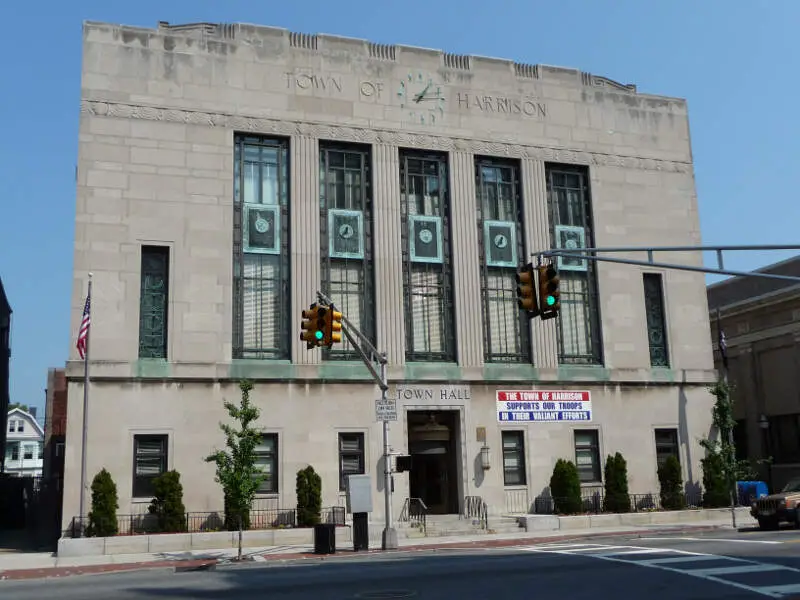
41.3 median age · 9.0% married households
Data | Crime | Cost of living | Movers
33.8 median age · 7.0% married households
Harrison is a town in Hudson County, New Jersey, United States. It is a suburb of the nearby city of Newark, New Jersey.
Data | Crime | Cost of living | Movers
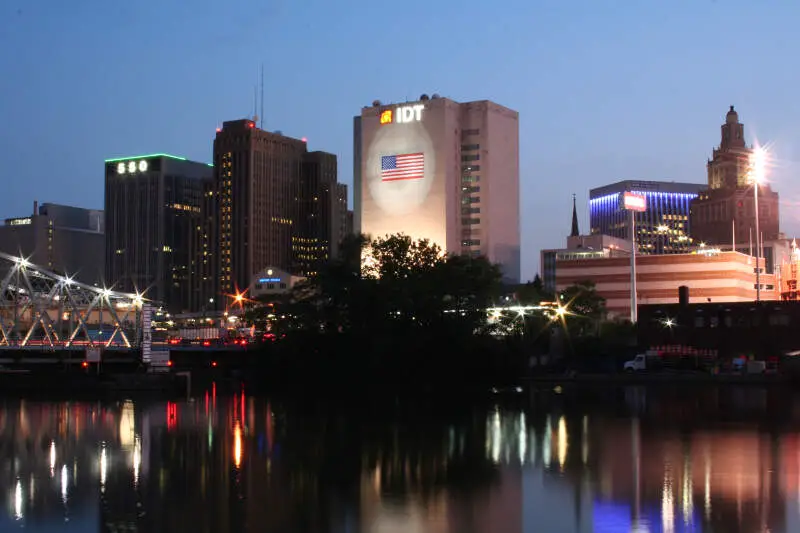
34.7 median age · 6.0% married households
Newark is the most populous city in the U.S. state of New Jersey and the seat of Essex County. As one of the nation’s major air, shipping, and rail hubs, the city had a population of 277,140 in 2010, making it the nation’s 67th-most populous municipality, after being ranked 63rd in the nation in 2000. For 2015, the Census Bureau’s Population Estimates Program calculated a population of 281,944, an increase of 1.7% from the 2010 enumeration, ranking the city the 70th largest in the nation. Newark is the second largest city in the New York metropolitan area, located approximately 8 miles west of lower Manhattan.
Data | Crime | Cost of living | Movers

41.8 median age · 6.0% married households
Hackensack is a city in Bergen County, New Jersey, United States, and serves as its county seat. The area was officially named New Barbadoes Township until 1921, but it was informally known as Hackensack. As of the 2010 United States Census, the city’s population was 43,010, reflecting an increase of 333 from the 42,677 counted in the 2000 Census, which had, in turn, increased by 5,628 from the 37,049 counted in the 1990 Census.
Data | Crime | Cost of living | Movers
40.6 median age · 6.0% married households
Edgewater is a borough located along the Hudson River in Bergen County, New Jersey, United States. As of the 2010 United States Census, the borough had a population of 11,513, reflecting an increase of 3,836 from the 7,677 counted in the 2000 Census, which had in turn increased by 2,676 from the 5,001 counted in the 1990 Census.
Data | Crime | Cost of living | Movers
The receipts
Compare the top ten
Pick a metric. The bars rescale. The red line is New Jersey’s statewide median.
On the map
Where New Jersey’s singles cluster
Saturday Night Science
Methodology: How do you determine which city is best for singles in New Jersey anyways?
To give you the places in New Jersey which are best for singles to find one another, we used Saturday Night Science to look at a handful of metrics. Of course, we want to measure the type of people who live in each city and make some assumptions about what single people like.
So we researched the internet for a database that contains all that information.
We threw a lot of criteria at this one to get the best, most complete results possible. Using the 2020-2024 American Community Survey Census data produced for the state of New Jersey, we looked at every single city in the state. We paid particular attention to:
- Population density
- % of population that’s male vs. female (closer to a 50-50 ratio is better)
- % of households with kids
- Median age
- Number of unmarried people in each city
We then gave each city a “Singles Score.”
The higher the score, the better the city is for singles to find one another. We also limited our results to cities with over 10,000 people. For New Jersey, that meant a total of 104 cities.
We updated this article for 2026. This is our eleventh time ranking the best cities for singles in New Jersey.
Read on to see why Hoboken is the talk of the town while Franklin Lakes is probably a bit on the bland side.
The full plate
Best Cities For Singles In New Jersey
Click any column to sort. Search by city name.
| Rank | City | Singles Score | Population | Median Age | % Married Households | % Households w/ Kids |
|---|---|---|---|---|---|---|
| 1 | Hoboken | 10.60 | 58,668 | 31.9 | 10.0% | 18.4% |
| 2 | Asbury Park | 18.60 | 15,295 | 38.2 | 13.0% | 19.0% |
| 3 | West New York | 19.40 | 52,004 | 37.2 | 3.0% | 29.6% |
| 4 | Highland Park | 21.10 | 15,121 | 35.2 | 9.0% | 23.0% |
| 5 | Trenton | 23.00 | 90,338 | 34.8 | 7.0% | 31.7% |
| 6 | Cliffside Park | 26.30 | 25,781 | 41.3 | 9.0% | 23.1% |
| 7 | Harrison | 26.40 | 20,369 | 33.8 | 7.0% | 22.1% |
| 8 | Newark | 26.60 | 310,178 | 34.7 | 6.0% | 34.5% |
| 9 | Hackensack | 26.60 | 46,057 | 41.8 | 6.0% | 20.9% |
| 10 | Edgewater | 28.40 | 14,759 | 40.6 | 6.0% | 21.2% |
| 11 | Lindenwold | 28.60 | 21,719 | 33.9 | 11.0% | 29.3% |
| 12 | Elizabeth | 29.30 | 137,302 | 35.8 | 5.0% | 40.2% |
| 13 | Paterson | 30.00 | 158,735 | 33.3 | 5.0% | 44.0% |
| 14 | Bayonne | 30.60 | 71,553 | 38.3 | 15.0% | 30.9% |
| 15 | Garfield | 30.80 | 32,783 | 38.8 | 7.0% | 34.5% |
| 16 | Roselle | 31.80 | 22,646 | 39.4 | 10.0% | 28.7% |
| 17 | Red Bank | 33.30 | 12,862 | 39.4 | 17.0% | 20.9% |
| 18 | Perth Amboy | 34.30 | 55,855 | 37.9 | 5.0% | 39.2% |
| 19 | Long Branch | 35.00 | 32,530 | 36.8 | 15.0% | 25.7% |
| 20 | Plainfield | 35.60 | 55,236 | 32.4 | 7.0% | 47.3% |
| 21 | East Orange | 36.00 | 70,090 | 37.4 | 7.0% | 28.4% |
| 22 | Fort Lee | 36.40 | 40,067 | 46.6 | 5.0% | 22.8% |
| 23 | New Brunswick | 36.80 | 56,345 | 24.8 | 4.0% | 35.5% |
| 24 | Guttenberg | 37.60 | 11,754 | 40.3 | 4.0% | 28.5% |
| 25 | Bound Brook | 38.10 | 12,219 | 38.0 | 12.0% | 35.3% |
| 26 | Roselle Park | 39.20 | 14,093 | 39.8 | 16.0% | 28.8% |
| 27 | Somerville | 39.30 | 13,410 | 35.9 | 21.0% | 25.7% |
| 28 | Passaic | 40.00 | 70,002 | 31.9 | 5.0% | 44.9% |
| 29 | Fairview | 40.30 | 15,099 | 38.6 | 5.0% | 33.7% |
| 30 | Clifton | 40.90 | 89,379 | 41.6 | 15.0% | 26.7% |
| 31 | Glassboro | 41.20 | 23,717 | 27.9 | 15.0% | 21.6% |
| 32 | Wallington | 41.30 | 11,889 | 38.7 | 13.0% | 30.6% |
| 33 | Palisades Park | 41.40 | 20,290 | 42.9 | 4.0% | 24.0% |
| 34 | North Plainfield | 42.30 | 22,809 | 36.2 | 10.0% | 31.0% |
| 35 | Phillipsburg | 43.00 | 15,299 | 39.6 | 23.0% | 27.1% |
| 36 | Freehold | 44.60 | 12,507 | 35.5 | 15.0% | 35.8% |
| 37 | Bellmawr | 45.30 | 11,737 | 38.7 | 21.0% | 29.4% |
| 38 | Ridgefield Park | 47.10 | 13,235 | 39.6 | 8.0% | 34.6% |
| 39 | Camden | 47.30 | 71,496 | 33.3 | 6.0% | 40.8% |
| 40 | Bergenfield | 47.50 | 28,450 | 40.7 | 8.0% | 36.2% |
| 41 | Pine Hill | 48.40 | 10,802 | 34.9 | 16.0% | 31.1% |
| 42 | New Milford | 48.60 | 16,995 | 39.6 | 15.0% | 33.2% |
| 43 | Ridgefield | 49.70 | 11,498 | 39.8 | 13.0% | 31.4% |
| 44 | Collingswood | 50.20 | 14,205 | 39.1 | 18.0% | 24.0% |
| 45 | Rahway | 50.60 | 30,109 | 39.7 | 15.0% | 30.1% |
| 46 | Secaucus | 51.10 | 21,778 | 38.4 | 13.0% | 27.8% |
| 47 | Elmwood Park | 51.30 | 21,412 | 39.9 | 16.0% | 32.6% |
| 48 | Sayreville | 51.70 | 45,838 | 39.9 | 14.0% | 31.3% |
| 49 | Wood-Ridge | 51.80 | 10,218 | 39.8 | 21.0% | 30.6% |
| 50 | Dover | 53.00 | 18,563 | 39.8 | 7.0% | 36.0% |
| 51 | Linden | 53.60 | 44,192 | 40.1 | 10.0% | 32.7% |
| 52 | Lodi | 53.90 | 26,082 | 41.1 | 12.0% | 31.6% |
| 53 | Carteret | 54.20 | 25,496 | 38.2 | 13.0% | 38.1% |
| 54 | Pleasantville | 54.30 | 20,712 | 34.7 | 7.0% | 35.8% |
| 55 | Maywood | 54.40 | 10,093 | 44.9 | 18.0% | 29.4% |
| 56 | Westwood | 54.60 | 11,283 | 41.4 | 21.0% | 33.1% |
| 57 | Fair Lawn | 54.70 | 35,610 | 39.1 | 13.0% | 41.4% |
| 58 | Little Ferry | 56.70 | 10,996 | 44.6 | 9.0% | 26.3% |
| 59 | Englewood | 56.80 | 29,638 | 41.5 | 6.0% | 32.6% |
| 60 | North Arlington | 57.10 | 16,461 | 40.1 | 23.0% | 28.1% |
| 61 | Hawthorne | 58.90 | 19,628 | 42.4 | 26.0% | 30.3% |
| 62 | Kearny | 59.30 | 40,614 | 40.0 | 11.0% | 32.2% |
| 63 | Woodland Park | 59.30 | 13,355 | 42.7 | 17.0% | 29.4% |
| 64 | Manville | 59.50 | 10,921 | 44.9 | 20.0% | 24.6% |
| 65 | Wanaque | 59.70 | 11,206 | 47.2 | 21.0% | 21.7% |
| 66 | South River | 60.10 | 16,124 | 37.0 | 25.0% | 37.1% |
| 67 | Bridgeton | 60.60 | 27,001 | 29.2 | 11.0% | 48.8% |
| 68 | Rutherford | 60.70 | 18,894 | 40.0 | 20.0% | 34.7% |
| 69 | Woodbury | 61.40 | 10,042 | 39.8 | 16.0% | 30.0% |
| 70 | Westfield | 61.60 | 31,111 | 40.7 | 20.0% | 43.8% |
| 71 | Somers Point | 61.70 | 10,515 | 43.6 | 20.0% | 21.4% |
| 72 | Dumont | 61.80 | 18,279 | 41.2 | 18.0% | 30.9% |
| 73 | Waldwick | 62.30 | 10,164 | 40.5 | 29.0% | 37.9% |
| 74 | East Rutherford | 63.50 | 10,313 | 38.2 | 17.0% | 31.3% |
| 75 | Summit | 63.60 | 22,705 | 41.8 | 16.0% | 38.2% |
| 76 | Madison | 63.90 | 16,447 | 38.2 | 18.0% | 36.1% |
| 77 | Paramus | 64.00 | 26,568 | 49.1 | 16.0% | 32.2% |
| 78 | Glen Rock | 64.00 | 12,154 | 39.7 | 16.0% | 51.9% |
| 79 | South Plainfield | 64.90 | 24,473 | 41.7 | 27.0% | 34.9% |
| 80 | Millville | 65.00 | 27,511 | 44.4 | 28.0% | 24.9% |
| 81 | Metuchen | 66.00 | 15,144 | 39.1 | 23.0% | 37.6% |
| 82 | Pompton Lakes | 66.00 | 11,047 | 39.7 | 31.0% | 31.1% |
| 83 | Beachwood | 67.50 | 11,088 | 42.5 | 32.0% | 28.8% |
| 84 | Ridgewood | 68.70 | 26,308 | 41.6 | 18.0% | 43.6% |
| 85 | Tenafly | 68.90 | 15,319 | 42.2 | 9.0% | 51.1% |
| 86 | Ramsey | 69.10 | 14,805 | 41.8 | 19.0% | 35.5% |
| 87 | Florham Park | 69.60 | 13,564 | 40.9 | 24.0% | 27.3% |
| 88 | Point Pleasant | 70.20 | 19,334 | 46.1 | 38.0% | 29.0% |
| 89 | Hammonton | 70.20 | 14,840 | 41.4 | 26.0% | 30.9% |
| 90 | Hasbrouck Heights | 70.40 | 12,115 | 44.3 | 19.0% | 34.7% |
| 91 | Lincoln Park | 70.40 | 10,957 | 48.3 | 22.0% | 23.9% |
| 92 | Hopatcong | 70.60 | 14,565 | 41.0 | 31.0% | 25.5% |
| 93 | Vineland | 71.50 | 61,006 | 38.8 | 24.0% | 34.9% |
| 94 | Haddonfield | 72.00 | 12,595 | 39.0 | 24.0% | 50.0% |
| 95 | River Edge | 78.00 | 12,091 | 43.6 | 21.0% | 35.6% |
| 96 | Ringwood | 78.30 | 11,657 | 42.6 | 32.0% | 26.6% |
| 97 | New Providence | 79.20 | 13,727 | 45.7 | 20.0% | 37.7% |
| 98 | Middlesex | 79.40 | 14,645 | 44.3 | 27.0% | 30.5% |
| 99 | Tinton Falls | 81.20 | 19,361 | 46.6 | 29.0% | 22.9% |
| 100 | Totowa | 81.20 | 10,959 | 42.0 | 28.0% | 35.0% |
Source: U.S. Census ACS 2020-2024. 104 cities with more than 10,000 residents.
Summary
Summary: The Best Cities For Singles In New Jersey For 2026
If you’re looking for a breakdown of cities in New Jersey ranked by criteria that most agree make a place a great spot for finding a single person (and potentially love), this is an accurate list.
The best cities for singles in New Jersey are Hoboken, Asbury Park, West New York, Highland Park, Trenton, Cliffside Park, Harrison, Newark, Hackensack, and Edgewater.


