Irvington, NY
Demographics And Statistics
Living In Irvington, New York Summary
Life in Irvington research summary. HomeSnacks has been using Saturday Night Science to research the quality of life in Irvington over the past nine years using Census, FBI, Zillow, and other primary data sources. Based on the most recently available data, we found the following about life in Irvington:
The population in Irvington is 6,541.
The median home value in Irvington is $1,206,842.
The median income in Irvington is $169,411.
The cost of living in Irvington is 170 which is 1.7x higher than the national average.
The median rent in Irvington is $2,376.
The unemployment rate in Irvington is 3.0%.
The poverty rate in Irvington is 1.7%.
The average high in Irvington is 62.4° and the average low is 44.4°.
Table Of Contents
Irvington SnackAbility
Overall SnackAbility
Irvington, NY Cost Of Living
Cost of living in Irvington summary. We use data on the cost of living to determine how expensive it is to live in Irvington. Real estate prices drive most of the variance in cost of living around New York. Key points include:
The cost of living in Irvington is 170 with 100 being average.
The cost of living in Irvington is 1.7x higher than the national average.
The median home value in Irvington is $1,206,842.
The median income in Irvington is $169,411.
Irvington's Overall Cost Of Living
Higher Than The National Average
Cost Of Living In Irvington Comparison Table
| Living Expense | Irvington | New York | National Average | |
|---|---|---|---|---|
| Overall | 170 | 119 | 100 | |
| Services | 114 | 110 | 100 | |
| Groceries | 104 | 103 | 100 | |
| Health | 109 | 101 | 100 | |
| Housing | 311 | 145 | 100 | |
| Transportation | 103 | 105 | 100 | |
| Utilities | 131 | 99 | 100 | |
Irvington, NY Weather
The average high in Irvington is 62.4° and the average low is 44.4°.
There are 80.9 days of precipitation each year.
Expect an average of 49.2 inches of precipitation each year with 29.5 inches of snow.
| Stat | Irvington |
|---|---|
| Average Annual High | 62.4 |
| Average Annual Low | 44.4 |
| Annual Precipitation Days | 80.9 |
| Average Annual Precipitation | 49.2 |
| Average Annual Snowfall | 29.5 |
Average High
Days of Rain
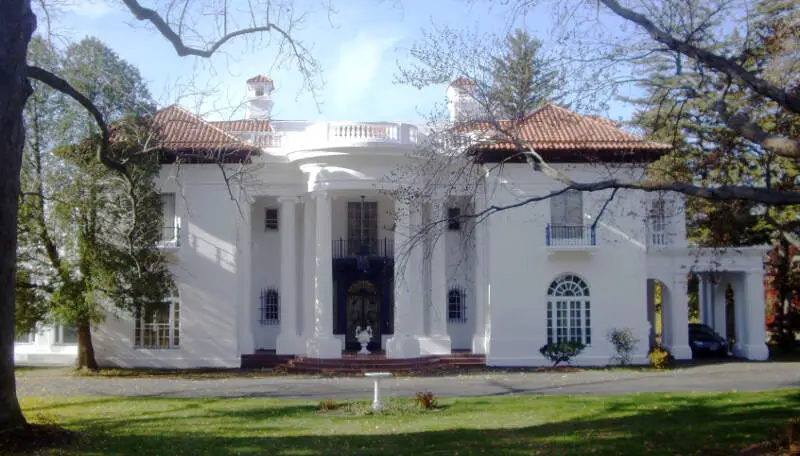
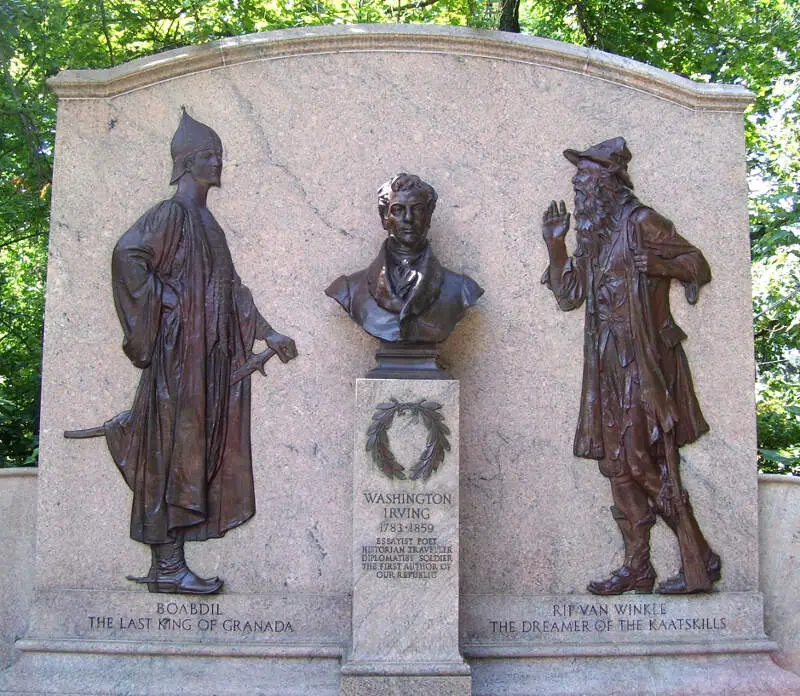
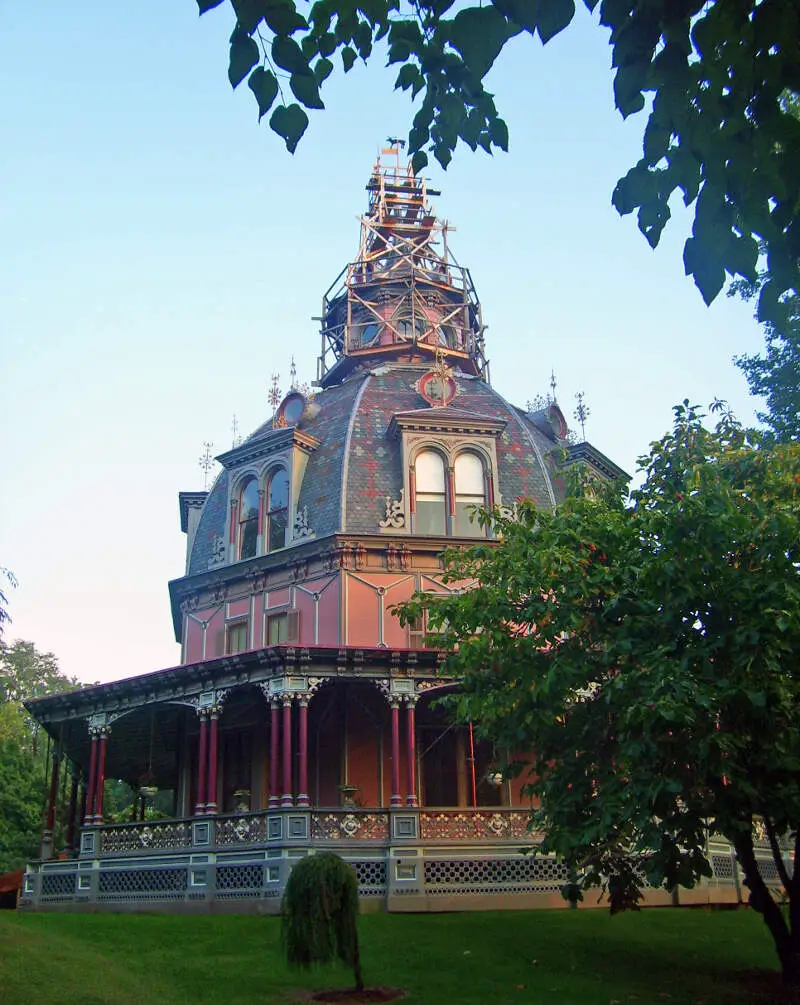
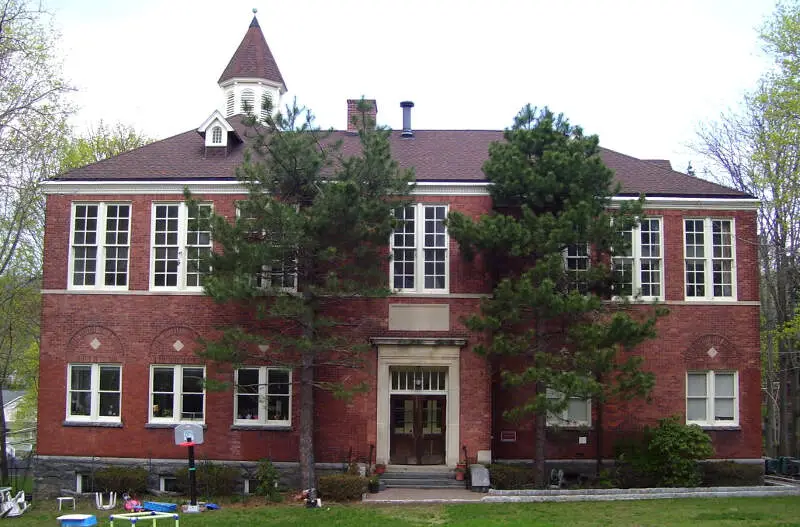
Irvington, NY Photos


1 Reviews & Comments About Irvington
/5

HomeSnacks User - None
Grew up in Briarcliff Manor, moved to Irvington after college and marriage. Had major culture shock after being transferred to REALLY boring town in the central part of,Virginia. Literally in the midst of no where, we are an hour away from any other town of any size.
Rankings for Irvington in New York


Locations Around Irvington
Map Of Irvington, NY
Best Places Around Irvington
Bronxville, NY
Population 6,539
Pelham Manor, NY
Population 5,648
Pleasantville, NY
Population 7,395
Larchmont, NY
Population 6,542
Briarcliff Manor, NY
Population 7,333
Port Washington, NY
Population 17,613
Tappan, NY
Population 6,704
Mamaroneck, NY
Population 19,840
Blauvelt, NY
Population 5,485
Eastchester, NY
Population 20,519
Irvington Demographics And Statistics
Population over time in Irvington
The current population in Irvington is 6,541. The population has increased 1.9% from 2010.
| Year | Population | % Change |
|---|---|---|
| 2023 | 6,541 | -0.7% |
| 2022 | 6,590 | -0.1% |
| 2021 | 6,594 | 1.5% |
| 2020 | 6,494 | -0.5% |
| 2019 | 6,529 | -0.2% |
| 2018 | 6,539 | -0.7% |
| 2017 | 6,588 | 0.4% |
| 2016 | 6,559 | 0.3% |
| 2015 | 6,540 | 0.5% |
| 2014 | 6,506 | 0.3% |
| 2013 | 6,488 | 0.7% |
| 2012 | 6,445 | 0.2% |
| 2011 | 6,429 | 0.2% |
| 2010 | 6,419 | - |
Race / Ethnicity in Irvington
Irvington is:
74.5% White with 4,871 White residents.
1.1% African American with 75 African American residents.
0.0% American Indian with 0 American Indian residents.
8.6% Asian with 565 Asian residents.
0.0% Hawaiian with 0 Hawaiian residents.
1.3% Other with 85 Other residents.
3.3% Two Or More with 214 Two Or More residents.
11.2% Hispanic with 731 Hispanic residents.
| Race | Irvington | NY | USA |
|---|---|---|---|
| White | 74.5% | 53.4% | 58.2% |
| African American | 1.1% | 13.6% | 12.0% |
| American Indian | 0.0% | 0.2% | 0.5% |
| Asian | 8.6% | 8.8% | 5.7% |
| Hawaiian | 0.0% | 0.0% | 0.2% |
| Other | 1.3% | 0.9% | 0.5% |
| Two Or More | 3.3% | 3.4% | 3.9% |
| Hispanic | 11.2% | 19.6% | 19.0% |
Gender in Irvington
Irvington is 50.2% female with 3,282 female residents.
Irvington is 49.8% male with 3,259 male residents.
| Gender | Irvington | NY | USA |
|---|---|---|---|
| Female | 50.2% | 51.2% | 50.5% |
| Male | 49.8% | 48.8% | 49.5% |
Highest level of educational attainment in Irvington for adults over 25
-1.0% of adults in Irvington completed < 9th grade.
2.0% of adults in Irvington completed 9-12th grade.
4.0% of adults in Irvington completed high school / ged.
4.0% of adults in Irvington completed some college.
5.0% of adults in Irvington completed associate's degree.
30.0% of adults in Irvington completed bachelor's degree.
34.0% of adults in Irvington completed master's degree.
16.0% of adults in Irvington completed professional degree.
6.0% of adults in Irvington completed doctorate degree.
| Education | Irvington | NY | USA |
|---|---|---|---|
| < 9th Grade | -1.0% | 5.0% | 5.0% |
| 9-12th Grade | 2.0% | 6.0% | 6.0% |
| High School / GED | 4.0% | 25.0% | 26.0% |
| Some College | 4.0% | 15.0% | 19.0% |
| Associate's Degree | 5.0% | 9.0% | 9.0% |
| Bachelor's Degree | 30.0% | 22.0% | 21.0% |
| Master's Degree | 34.0% | 13.0% | 10.0% |
| Professional Degree | 16.0% | 3.0% | 2.0% |
| Doctorate Degree | 6.0% | 2.0% | 2.0% |
Household Income For Irvington, New York
1.2% of households in Irvington earn Less than $10,000.
0.0% of households in Irvington earn $10,000 to $14,999.
0.7% of households in Irvington earn $15,000 to $24,999.
2.8% of households in Irvington earn $25,000 to $34,999.
5.6% of households in Irvington earn $35,000 to $49,999.
8.6% of households in Irvington earn $50,000 to $74,999.
8.8% of households in Irvington earn $75,000 to $99,999.
7.2% of households in Irvington earn $100,000 to $149,999.
21.3% of households in Irvington earn $150,000 to $199,999.
43.9% of households in Irvington earn $200,000 or more.
| Income | Irvington | NY | USA |
|---|---|---|---|
| Less than $10,000 | 1.2% | 5.7% | 4.9% |
| $10,000 to $14,999 | 0.0% | 4.1% | 3.6% |
| $15,000 to $24,999 | 0.7% | 6.5% | 6.6% |
| $25,000 to $34,999 | 2.8% | 6.2% | 6.8% |
| $35,000 to $49,999 | 5.6% | 9.1% | 10.4% |
| $50,000 to $74,999 | 8.6% | 13.8% | 15.7% |
| $75,000 to $99,999 | 8.8% | 11.4% | 12.7% |
| $100,000 to $149,999 | 7.2% | 16.8% | 17.4% |
| $150,000 to $199,999 | 21.3% | 10.1% | 9.3% |
| $200,000 or more | 43.9% | 16.4% | 12.6% |


