Peekskill SnackAbility
Overall SnackAbility
Crime in Peekskill summary. We use data from the FBI to determine the crime rates in Peekskill. Key points include:
There were 301 total crimes in Peekskill in the last reporting year.
The overall crime rate per 100,000 people in Peekskill is 1,181.1 / 100k people.
The violent crime rate per 100,000 people in Peekskill is 208.0 / 100k people.
The property crime rate per 100,000 people in Peekskill is 973.2 / 100k people.
Overall, crime in Peekskill is -44.27% below the national average.
Total Crimes
Below National Average
Crime In Peekskill Comparison Table
| Statistic | Count Raw |
Peekskill / 100k People |
New York / 100k People |
National / 100k People |
|---|---|---|---|---|
| Total Crimes Per 100K | 301 | 1,181.1 | 2,099.7 | 2,119.2 |
| Violent Crime | 53 | 208.0 | 380.2 | 359.0 |
| Murder | 1 | 3.9 | 2.7 | 5.0 |
| Robbery | 6 | 23.5 | 96.1 | 61.0 |
| Aggravated Assault | 44 | 172.7 | 259.6 | 256.0 |
| Property Crime | 248 | 973.2 | 1,719.5 | 1,760.0 |
| Burglary | 21 | 82.4 | 136.6 | 229.0 |
| Larceny | 215 | 843.7 | 1,432.8 | 1,272.0 |
| Car Theft | 12 | 47.1 | 150.2 | 259.0 |
Source: FBI Uniform Crime Reporting (2024)
Cost of living in Peekskill summary. We use data on the cost of living to determine how expensive it is to live in Peekskill. Real estate prices drive most of the variance in cost of living around New York. Key points include:
The cost of living in Peekskill is 124 with 100 being average.
The cost of living in Peekskill is 1.2x higher than the national average.
The median home value in Peekskill is $500,839.
The median income in Peekskill is $85,954.
Peekskill's Overall Cost Of Living
Higher Than The National Average
Cost Of Living In Peekskill Comparison Table
| Living Expense | Peekskill | New York | National Average |
|---|---|---|---|
| Overall | 124 | 121 | 100 |
| Services | 104 | 105 | 100 |
| Groceries | 113 | 108 | 100 |
| Health | 157 | 143 | 100 |
| Housing | 113 | 112 | 100 |
| Transportation | 112 | 114 | 100 |
| Utilities | 108 | 111 | 100 |
Source: Cost of living index, normalized to US average = 100
Peekskill, NY Weather
The average high in Peekskill is 61.9° and the average low is 42.4°.
There are 82.2 days of precipitation each year.
Expect an average of 48.7 inches of precipitation each year with 36.0 inches of snow.
| Stat | Peekskill |
|---|---|
| Average Annual High | 61.9 |
| Average Annual Low | 42.4 |
| Annual Precipitation Days | 82.2 |
| Average Annual Precipitation | 48.7 |
| Average Annual Snowfall | 36.0 |
Average High
Days of Rain
Source: NOAA climate normals (30-year)
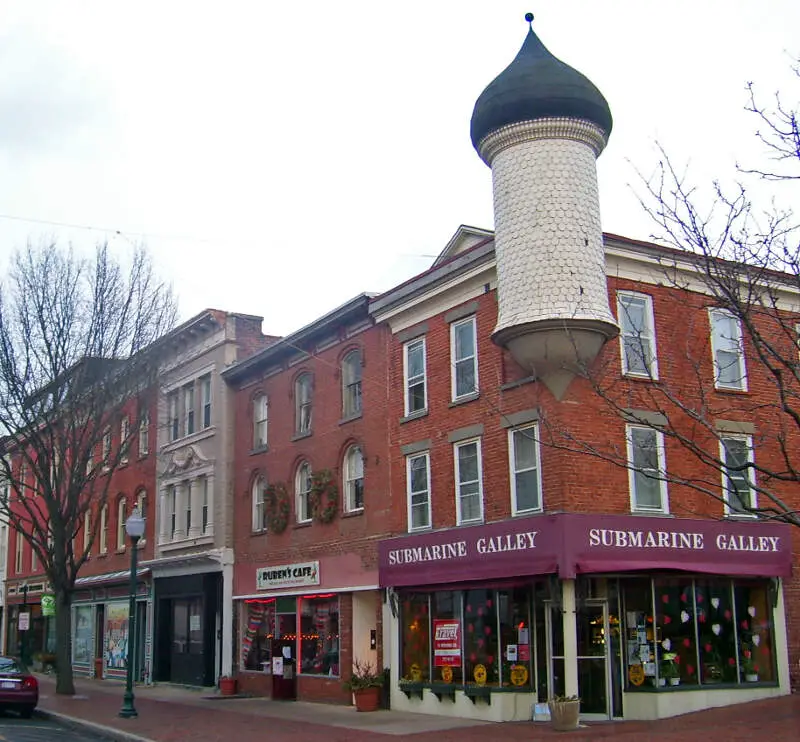
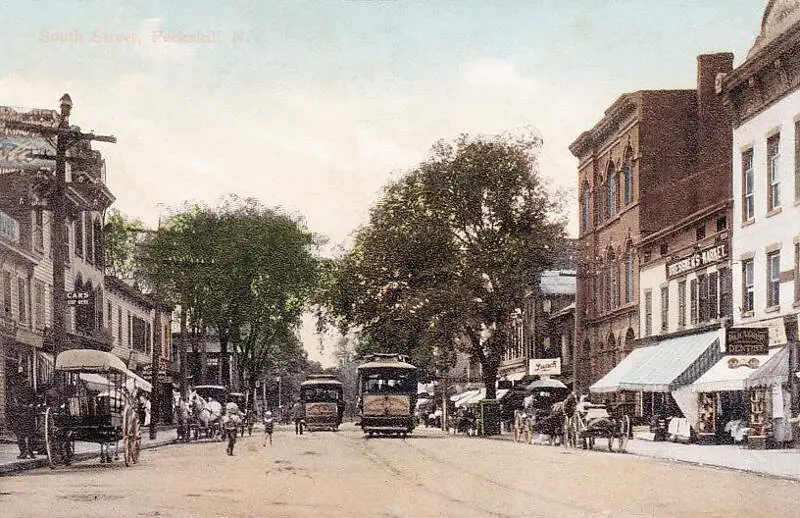
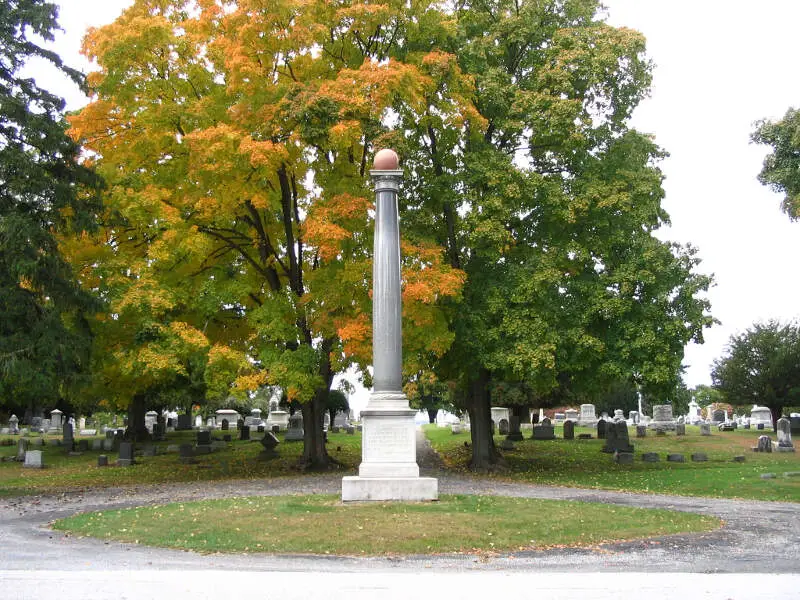
Peekskill, NY Photos


Rankings & Articles For Peekskill


Locations Around Peekskill
Map Of Peekskill, NY
Best Places Around Peekskill
Pleasantville, NY
Population 7,371
Briarcliff Manor, NY
Population 7,519
Tappan, NY
Population 6,687
Irvington, NY
Population 6,531
Blauvelt, NY
Population 5,406
Dobbs Ferry, NY
Population 11,443
Congers, NY
Population 8,275
Jefferson Valley-Yorktown, NY
Population 14,154
Hillcrest, NY
Population 9,071
Peekskill Demographics And Statistics
Population over time in Peekskill
The current population in Peekskill is 25,625. The population has increased 10.4% from 2010.
| Year | Population | % Change |
|---|---|---|
| 2024 | 25,625 | 0.6% |
| 2023 | 25,484 | 0.3% |
| 2022 | 25,401 | 0.4% |
| 2021 | 25,304 | 4.9% |
| 2020 | 24,111 | 0.1% |
| 2019 | 24,075 | 0.3% |
| 2018 | 24,008 | -0.4% |
| 2017 | 24,111 | 0.6% |
| 2016 | 23,977 | 0.2% |
| 2015 | 23,928 | 0.2% |
| 2014 | 23,875 | 0.7% |
| 2013 | 23,702 | 0.6% |
| 2012 | 23,568 | 0.8% |
| 2011 | 23,392 | 0.7% |
| 2010 | 23,220 | - |
Race / Ethnicity in Peekskill
See the full breakdown
Peekskill is:
35.3% White with 9,044 White residents.
13.4% African American with 3,427 African American residents.
0.1% American Indian with 17 American Indian residents.
1.9% Asian with 499 Asian residents.
0.0% Hawaiian with 0 Hawaiian residents.
1.5% Other with 374 Other residents.
2.2% Two Or More with 556 Two Or More residents.
45.7% Hispanic with 11,708 Hispanic residents.
| Race | Peekskill | NY | USA |
|---|---|---|---|
| White | 35.3% | 52.8% | 57.4% |
| African American | 13.4% | 13.4% | 11.9% |
| American Indian | 0.1% | 0.2% | 0.5% |
| Asian | 1.9% | 9.0% | 5.9% |
| Hawaiian | 0.0% | 0.0% | 0.2% |
| Other | 1.5% | 1.0% | 0.6% |
| Two Or More | 2.2% | 3.8% | 4.3% |
| Hispanic | 45.7% | 19.8% | 19.3% |
Gender in Peekskill
See the full breakdown
Peekskill is 48.6% female with 12,462 female residents.
Peekskill is 51.4% male with 13,162 male residents.
| Gender | Peekskill | NY | USA |
|---|---|---|---|
| Female | 48.6% | 51.2% | 50.5% |
| Male | 51.4% | 48.8% | 49.5% |
Highest level of educational attainment in Peekskill for adults over 25
See the full breakdown
10.0% of adults in Peekskill completed < 9th grade.
6.0% of adults in Peekskill completed 9-12th grade.
24.0% of adults in Peekskill completed high school / ged.
15.0% of adults in Peekskill completed some college.
7.0% of adults in Peekskill completed associate's degree.
20.0% of adults in Peekskill completed bachelor's degree.
15.0% of adults in Peekskill completed master's degree.
2.0% of adults in Peekskill completed professional degree.
1.0% of adults in Peekskill completed doctorate degree.
| Education | Peekskill | NY | USA |
|---|---|---|---|
| < 9th Grade | 10.0% | 6.0% | 4.0% |
| 9-12th Grade | 6.0% | 6.0% | 6.0% |
| High School / GED | 24.0% | 24.0% | 26.0% |
| Some College | 15.0% | 15.0% | 19.0% |
| Associate's Degree | 7.0% | 9.0% | 9.0% |
| Bachelor's Degree | 20.0% | 22.0% | 22.0% |
| Master's Degree | 15.0% | 13.0% | 10.0% |
| Professional Degree | 2.0% | 3.0% | 2.0% |
| Doctorate Degree | 1.0% | 2.0% | 2.0% |
Household Income For Peekskill, New York
See the full breakdown
5.6% of households in Peekskill earn Less than $10,000.
2.7% of households in Peekskill earn $10,000 to $14,999.
3.8% of households in Peekskill earn $15,000 to $24,999.
6.1% of households in Peekskill earn $25,000 to $34,999.
8.2% of households in Peekskill earn $35,000 to $49,999.
16.8% of households in Peekskill earn $50,000 to $74,999.
14.9% of households in Peekskill earn $75,000 to $99,999.
21.3% of households in Peekskill earn $100,000 to $149,999.
6.4% of households in Peekskill earn $150,000 to $199,999.
14.2% of households in Peekskill earn $200,000 or more.
| Income | Peekskill | NY | USA |
|---|---|---|---|
| Less than $10,000 | 5.6% | 5.8% | 5.0% |
| $10,000 to $14,999 | 2.7% | 3.9% | 3.4% |
| $15,000 to $24,999 | 3.8% | 6.3% | 6.3% |
| $25,000 to $34,999 | 6.1% | 6.2% | 6.6% |
| $35,000 to $49,999 | 8.2% | 8.9% | 10.1% |
| $50,000 to $74,999 | 16.8% | 13.6% | 15.5% |
| $75,000 to $99,999 | 14.9% | 11.4% | 12.6% |
| $100,000 to $149,999 | 21.3% | 16.7% | 17.5% |
| $150,000 to $199,999 | 6.4% | 10.1% | 9.6% |
| $200,000 or more | 14.2% | 17.1% | 13.4% |
Source: U.S. Census ACS 5-year estimates (2024)


