Pelham, NY
Demographics And Statistics
Living In Pelham, New York Summary
Life in Pelham research summary. HomeSnacks has been using Saturday Night Science to research the quality of life in Pelham over the past nine years using Census, FBI, Zillow, and other primary data sources. Based on the most recently available data, we found the following about life in Pelham:
The population in Pelham is 7,247.
The median home value in Pelham is $1,311,674.
The median income in Pelham is $179,561.
The cost of living in Pelham is 181 which is 1.8x higher than the national average.
The median rent in Pelham is $2,288.
The unemployment rate in Pelham is 5.6%.
The poverty rate in Pelham is 3.5%.
The average high in Pelham is None° and the average low is None°.
Table Of Contents
Pelham SnackAbility
Overall SnackAbility
Pelham, NY Cost Of Living
Cost of living in Pelham summary. We use data on the cost of living to determine how expensive it is to live in Pelham. Real estate prices drive most of the variance in cost of living around New York. Key points include:
The cost of living in Pelham is 181 with 100 being average.
The cost of living in Pelham is 1.8x higher than the national average.
The median home value in Pelham is $1,311,674.
The median income in Pelham is $179,561.
Pelham's Overall Cost Of Living
Higher Than The National Average
Cost Of Living In Pelham Comparison Table
| Living Expense | Pelham | New York | National Average | |
|---|---|---|---|---|
| Overall | 181 | 119 | 100 | |
| Services | 127 | 110 | 100 | |
| Groceries | 115 | 103 | 100 | |
| Health | 119 | 101 | 100 | |
| Housing | 320 | 145 | 100 | |
| Transportation | 117 | 105 | 100 | |
| Utilities | 103 | 99 | 100 | |
Pelham, NY Weather
The average high in Pelham is None° and the average low is None°.
There are None days of precipitation each year.
Expect an average of None inches of precipitation each year with None inches of snow.
| Stat | Pelham |
|---|---|
| Average Annual High | None |
| Average Annual Low | None |
| Annual Precipitation Days | None |
| Average Annual Precipitation | None |
| Average Annual Snowfall | None |
Average High
Days of Rain
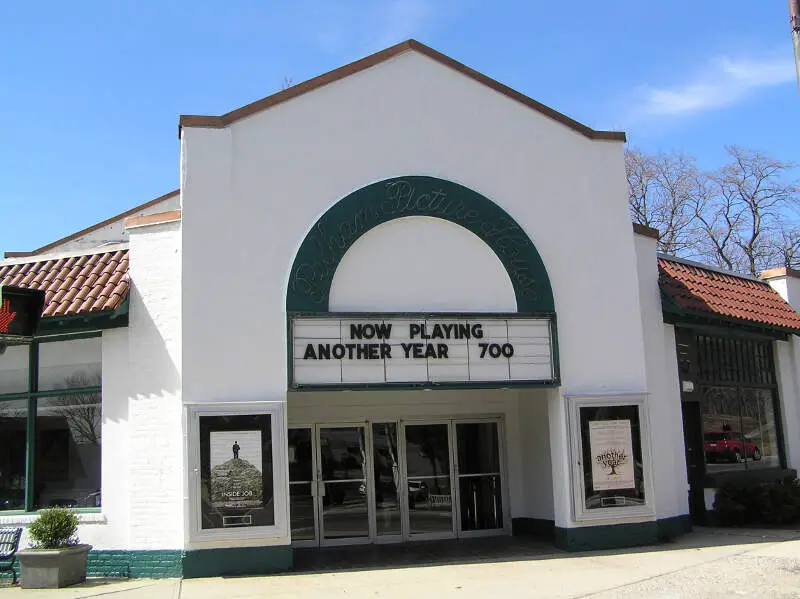
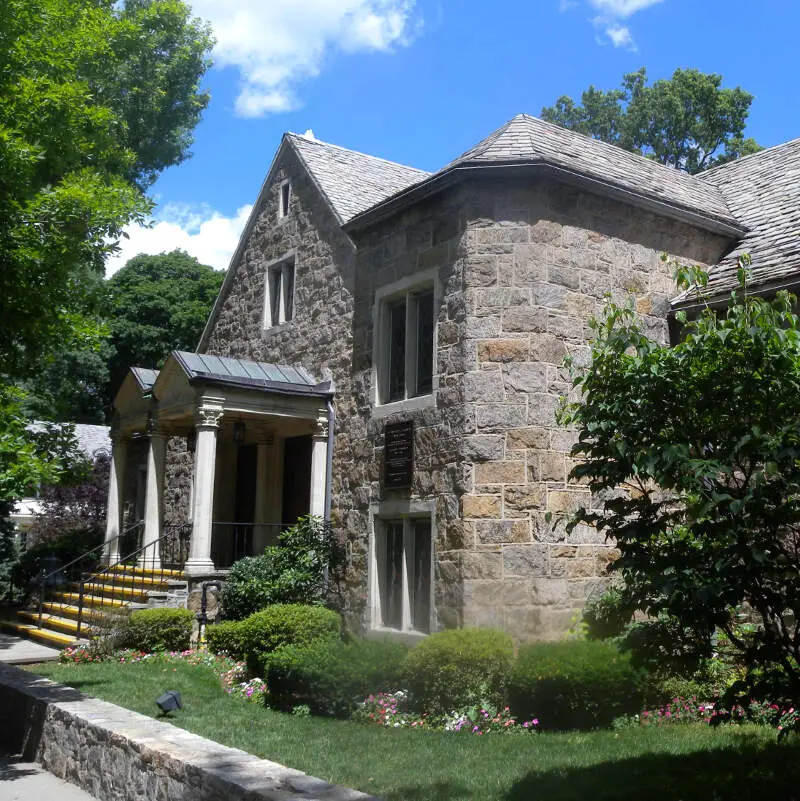
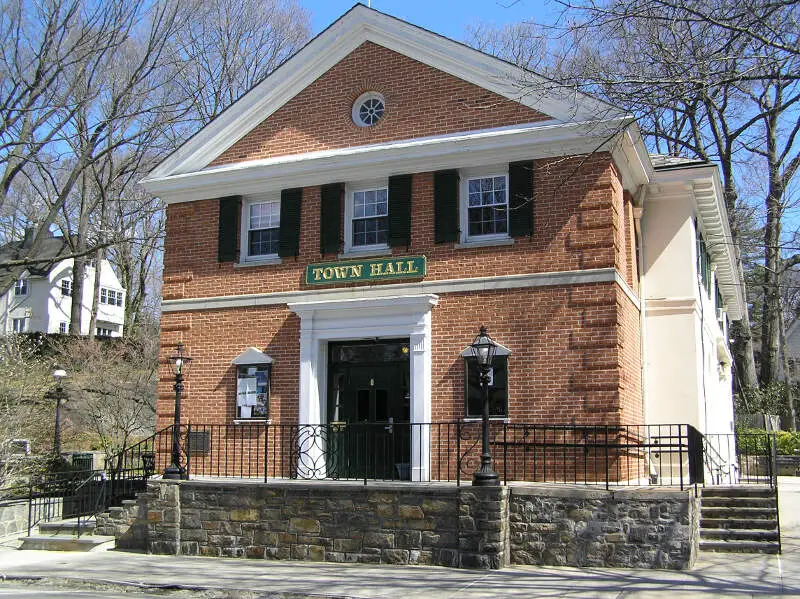
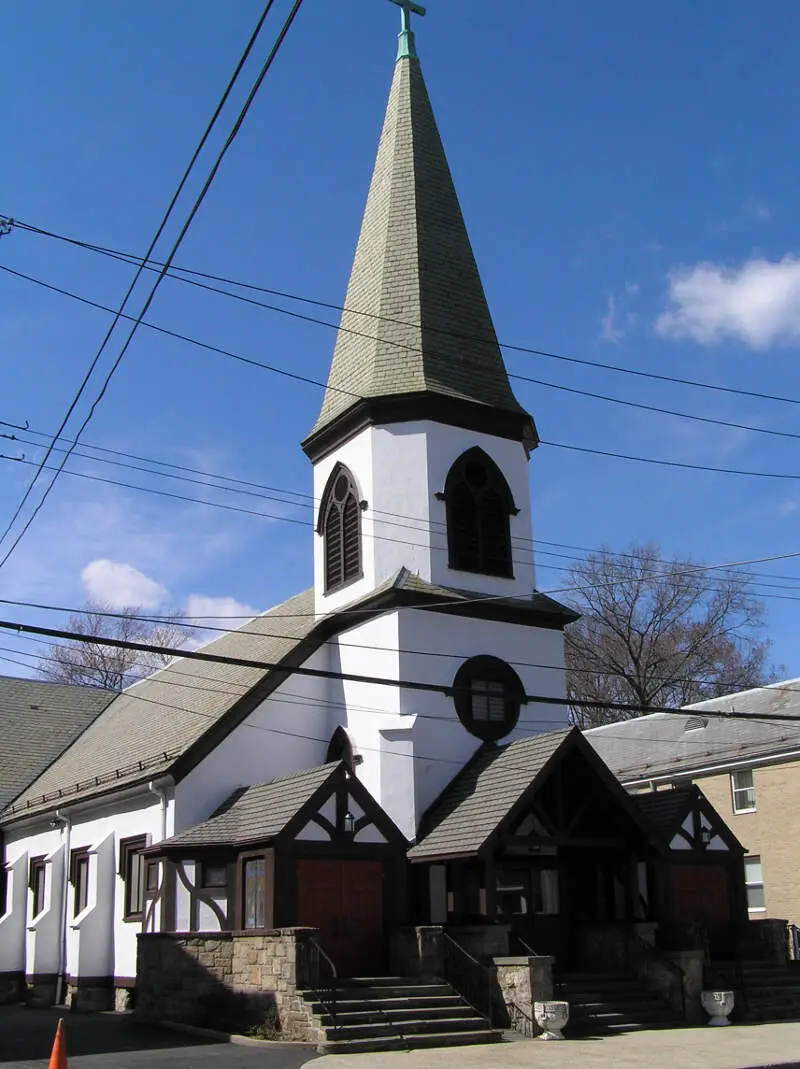
Pelham, NY Photos

Rankings for Pelham in New York


Locations Around Pelham
Map Of Pelham, NY
Best Places Around Pelham
Malverne, NY
Population 8,496
Plainview, NY
Population 26,251
Woodmere, NY
Population 18,198
Syosset, NY
Population 18,274
Bronxville, NY
Population 6,539
Pelham Manor, NY
Population 5,648
North New Hyde Park, NY
Population 14,354
Jericho, NY
Population 14,117
East Hills, NY
Population 7,249
Pleasantville, NY
Population 7,395
Pelham Demographics And Statistics
Population over time in Pelham
The current population in Pelham is 7,247. The population has increased 7.0% from 2010.
| Year | Population | % Change |
|---|---|---|
| 2023 | 7,247 | -0.2% |
| 2022 | 7,261 | 0.1% |
| 2021 | 7,255 | 4.3% |
| 2020 | 6,957 | 0.2% |
| 2019 | 6,941 | -0.1% |
| 2018 | 6,949 | -1.0% |
| 2017 | 7,016 | 0.3% |
| 2016 | 6,996 | 0.0% |
| 2015 | 6,993 | 0.1% |
| 2014 | 6,984 | 0.9% |
| 2013 | 6,920 | 0.4% |
| 2012 | 6,894 | 0.8% |
| 2011 | 6,837 | 0.9% |
| 2010 | 6,776 | - |
Race / Ethnicity in Pelham
Pelham is:
60.2% White with 4,361 White residents.
8.9% African American with 642 African American residents.
0.0% American Indian with 0 American Indian residents.
6.2% Asian with 450 Asian residents.
0.0% Hawaiian with 0 Hawaiian residents.
2.1% Other with 151 Other residents.
6.1% Two Or More with 443 Two Or More residents.
16.6% Hispanic with 1,200 Hispanic residents.
| Race | Pelham | NY | USA |
|---|---|---|---|
| White | 60.2% | 53.4% | 58.2% |
| African American | 8.9% | 13.6% | 12.0% |
| American Indian | 0.0% | 0.2% | 0.5% |
| Asian | 6.2% | 8.8% | 5.7% |
| Hawaiian | 0.0% | 0.0% | 0.2% |
| Other | 2.1% | 0.9% | 0.5% |
| Two Or More | 6.1% | 3.4% | 3.9% |
| Hispanic | 16.6% | 19.6% | 19.0% |
Gender in Pelham
Pelham is 48.0% female with 3,476 female residents.
Pelham is 52.0% male with 3,770 male residents.
| Gender | Pelham | NY | USA |
|---|---|---|---|
| Female | 48.0% | 51.2% | 50.5% |
| Male | 52.0% | 48.8% | 49.5% |
Highest level of educational attainment in Pelham for adults over 25
1.0% of adults in Pelham completed < 9th grade.
2.0% of adults in Pelham completed 9-12th grade.
15.0% of adults in Pelham completed high school / ged.
8.0% of adults in Pelham completed some college.
6.0% of adults in Pelham completed associate's degree.
31.0% of adults in Pelham completed bachelor's degree.
24.0% of adults in Pelham completed master's degree.
11.0% of adults in Pelham completed professional degree.
2.0% of adults in Pelham completed doctorate degree.
| Education | Pelham | NY | USA |
|---|---|---|---|
| < 9th Grade | 1.0% | 5.0% | 5.0% |
| 9-12th Grade | 2.0% | 6.0% | 6.0% |
| High School / GED | 15.0% | 25.0% | 26.0% |
| Some College | 8.0% | 15.0% | 19.0% |
| Associate's Degree | 6.0% | 9.0% | 9.0% |
| Bachelor's Degree | 31.0% | 22.0% | 21.0% |
| Master's Degree | 24.0% | 13.0% | 10.0% |
| Professional Degree | 11.0% | 3.0% | 2.0% |
| Doctorate Degree | 2.0% | 2.0% | 2.0% |
Household Income For Pelham, New York
2.3% of households in Pelham earn Less than $10,000.
0.2% of households in Pelham earn $10,000 to $14,999.
2.1% of households in Pelham earn $15,000 to $24,999.
3.5% of households in Pelham earn $25,000 to $34,999.
2.4% of households in Pelham earn $35,000 to $49,999.
5.1% of households in Pelham earn $50,000 to $74,999.
5.9% of households in Pelham earn $75,000 to $99,999.
16.9% of households in Pelham earn $100,000 to $149,999.
19.0% of households in Pelham earn $150,000 to $199,999.
42.6% of households in Pelham earn $200,000 or more.
| Income | Pelham | NY | USA |
|---|---|---|---|
| Less than $10,000 | 2.3% | 5.7% | 4.9% |
| $10,000 to $14,999 | 0.2% | 4.1% | 3.6% |
| $15,000 to $24,999 | 2.1% | 6.5% | 6.6% |
| $25,000 to $34,999 | 3.5% | 6.2% | 6.8% |
| $35,000 to $49,999 | 2.4% | 9.1% | 10.4% |
| $50,000 to $74,999 | 5.1% | 13.8% | 15.7% |
| $75,000 to $99,999 | 5.9% | 11.4% | 12.7% |
| $100,000 to $149,999 | 16.9% | 16.8% | 17.4% |
| $150,000 to $199,999 | 19.0% | 10.1% | 9.3% |
| $200,000 or more | 42.6% | 16.4% | 12.6% |


