Schenectady SnackAbility
Overall SnackAbility
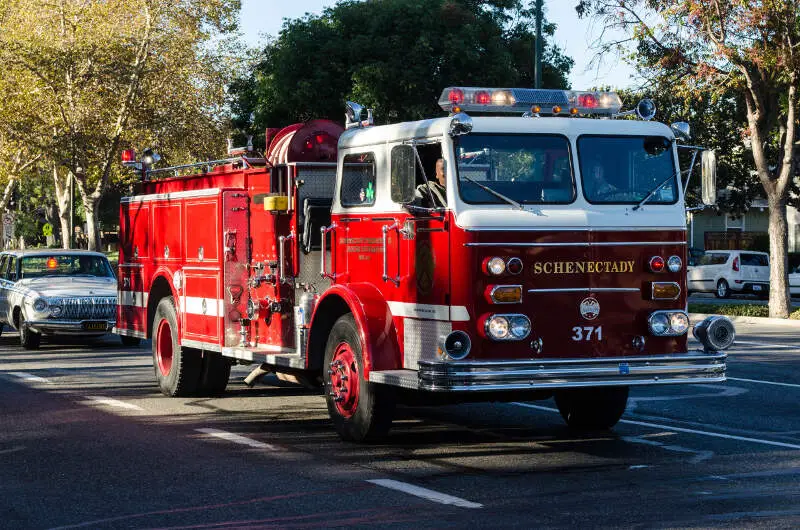
Crime in Schenectady summary. We use data from the FBI to determine the crime rates in Schenectady. Key points include:
There were 2,590 total crimes in Schenectady in the last reporting year.
The overall crime rate per 100,000 people in Schenectady is 3,775.0 / 100k people.
The violent crime rate per 100,000 people in Schenectady is 645.7 / 100k people.
The property crime rate per 100,000 people in Schenectady is 3,129.3 / 100k people.
Overall, crime in Schenectady is 78.13% above the national average.
Total Crimes
Above National Average
Crime In Schenectady Comparison Table
| Statistic | Count Raw |
Schenectady / 100k People |
New York / 100k People |
National / 100k People |
|---|---|---|---|---|
| Total Crimes Per 100K | 2,590 | 3,775.0 | 2,099.7 | 2,119.2 |
| Violent Crime | 443 | 645.7 | 380.2 | 359.0 |
| Murder | 7 | 10.2 | 2.7 | 5.0 |
| Robbery | 69 | 100.6 | 96.1 | 61.0 |
| Aggravated Assault | 328 | 478.1 | 259.6 | 256.0 |
| Property Crime | 2,147 | 3,129.3 | 1,719.5 | 1,760.0 |
| Burglary | 275 | 400.8 | 136.6 | 229.0 |
| Larceny | 1,721 | 2,508.4 | 1,432.8 | 1,272.0 |
| Car Theft | 151 | 220.1 | 150.2 | 259.0 |
Source: FBI Uniform Crime Reporting (2024)
Cost of living in Schenectady summary. We use data on the cost of living to determine how expensive it is to live in Schenectady. Real estate prices drive most of the variance in cost of living around New York. Key points include:
The cost of living in Schenectady is 97 with 100 being average.
The cost of living in Schenectady is 1.0x lower than the national average.
The median home value in Schenectady is $318,449.
The median income in Schenectady is $58,399.
Schenectady's Overall Cost Of Living
Lower Than The National Average
Cost Of Living In Schenectady Comparison Table
| Living Expense | Schenectady | New York | National Average |
|---|---|---|---|
| Overall | 97 | 121 | 100 |
| Services | 104 | 105 | 100 |
| Groceries | 112 | 108 | 100 |
| Health | 71 | 143 | 100 |
| Housing | 110 | 112 | 100 |
| Transportation | 110 | 114 | 100 |
| Utilities | 113 | 111 | 100 |
Source: Cost of living index, normalized to US average = 100
Schenectady, NY Weather
The average high in Schenectady is 57.6° and the average low is 38.5°.
There are 79.3 days of precipitation each year.
Expect an average of 39.7 inches of precipitation each year with 58.2 inches of snow.
| Stat | Schenectady |
|---|---|
| Average Annual High | 57.6 |
| Average Annual Low | 38.5 |
| Annual Precipitation Days | 79.3 |
| Average Annual Precipitation | 39.7 |
| Average Annual Snowfall | 58.2 |
Average High
Days of Rain
Source: NOAA climate normals (30-year)
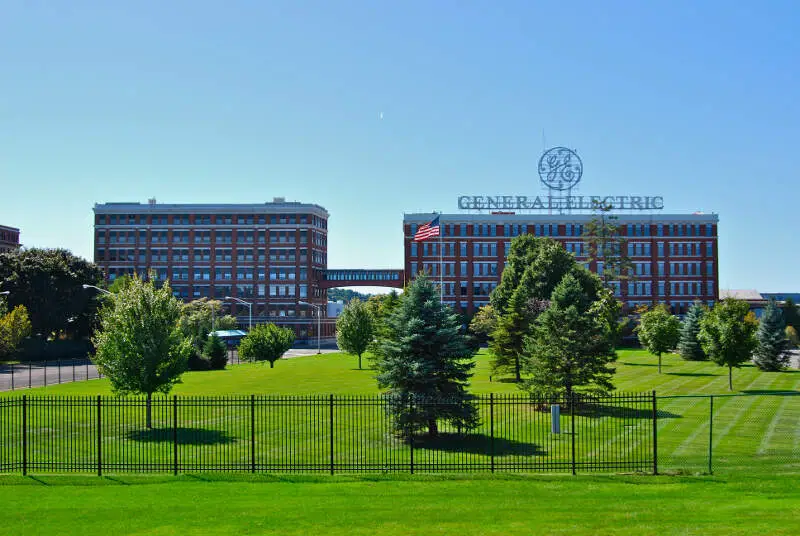
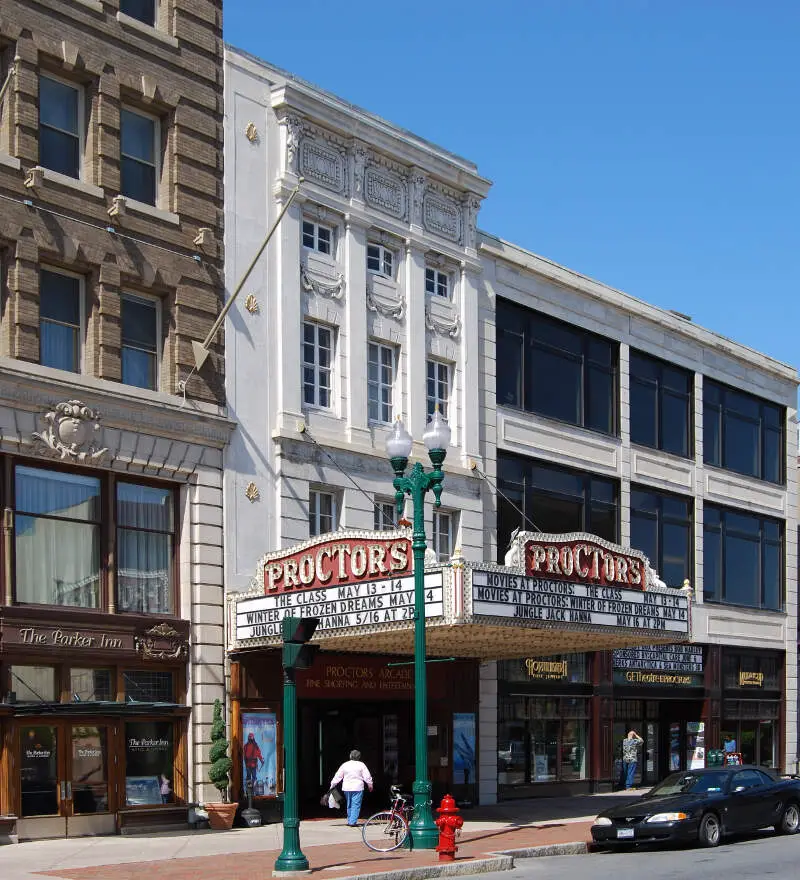
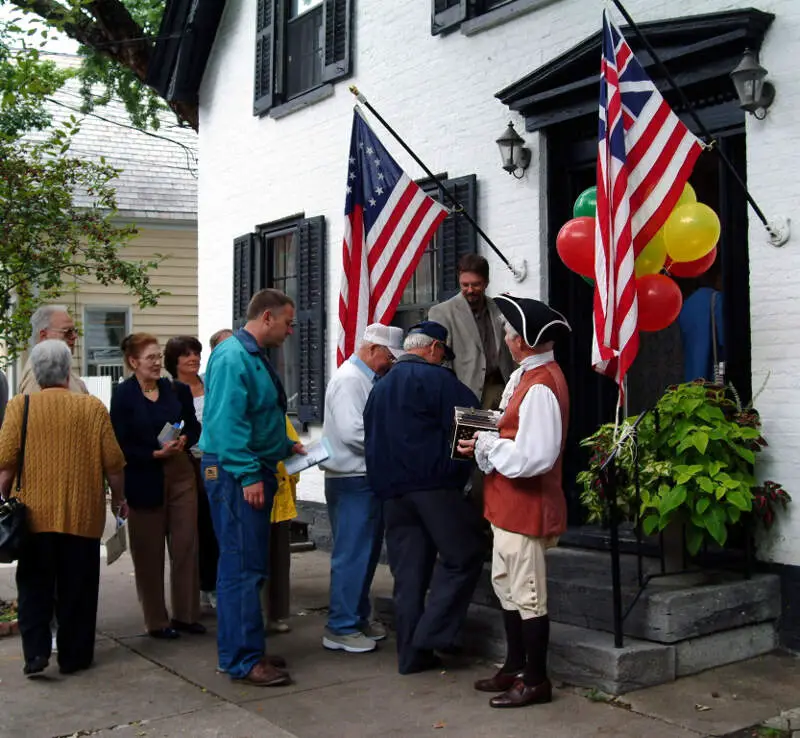
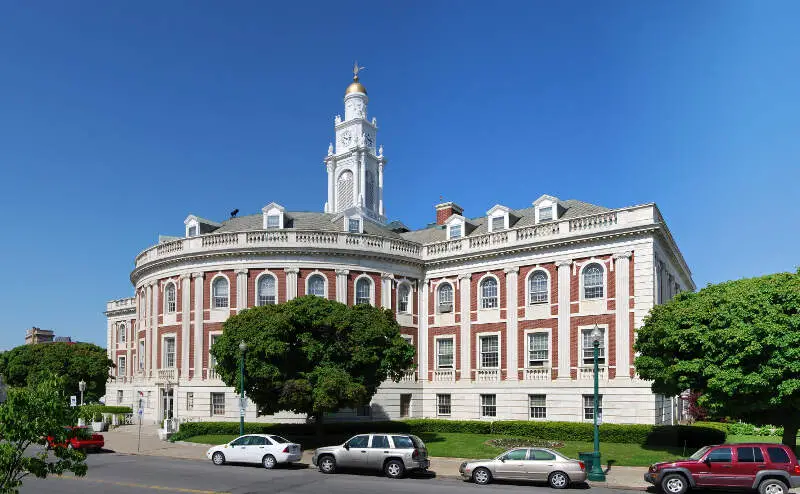
Schenectady, NY Photos

1 Reviews & Comments About Schenectady

Schenectady NY downtown is booming! Proctors, new casino, brand new beautiful rail station, plentiful parking, and restaurants and bars filled every weekend downtown.
A trip through downtown on state street and erie blvd reveals traffic and lots of mixed use buildings going up. Thats not to say neighborhoods dont have their challenges, but neighborhood clean ups should be a concerted effort by the stakeholders who live there.
Rankings & Articles For Schenectady


Locations Around Schenectady
Map Of Schenectady, NY
Best Places Around Schenectady
Colonie, NY
Population 7,702
Niskayuna, NY
Population 21,227
Westmere, NY
Population 8,334
Cohoes, NY
Population 18,159
Saratoga Springs, NY
Population 28,631
Rensselaer, NY
Population 9,287
Mechanicville, NY
Population 5,124
Scotia, NY
Population 7,264
Ballston Spa, NY
Population 5,027
Albany, NY
Population 100,492
Schenectady Demographics And Statistics
Population over time in Schenectady
The current population in Schenectady is 68,847. The population has increased 5.3% from 2010.
| Year | Population | % Change |
|---|---|---|
| 2024 | 68,847 | 0.5% |
| 2023 | 68,521 | 0.1% |
| 2022 | 68,476 | 2.5% |
| 2021 | 66,809 | 2.3% |
| 2020 | 65,336 | 0.0% |
| 2019 | 65,334 | -0.2% |
| 2018 | 65,482 | -0.3% |
| 2017 | 65,705 | 0.2% |
| 2016 | 65,554 | -0.3% |
| 2015 | 65,735 | -0.5% |
| 2014 | 66,055 | 0.1% |
| 2013 | 65,990 | 0.1% |
| 2012 | 65,921 | 0.3% |
| 2011 | 65,702 | 0.5% |
| 2010 | 65,366 | - |
Race / Ethnicity in Schenectady
See the full breakdown
Schenectady is:
47.5% White with 32,679 White residents.
18.7% African American with 12,865 African American residents.
0.3% American Indian with 182 American Indian residents.
5.9% Asian with 4,071 Asian residents.
0.1% Hawaiian with 39 Hawaiian residents.
3.3% Other with 2,251 Other residents.
11.6% Two Or More with 8,017 Two Or More residents.
12.7% Hispanic with 8,743 Hispanic residents.
| Race | Schenectady | NY | USA |
|---|---|---|---|
| White | 47.5% | 52.8% | 57.4% |
| African American | 18.7% | 13.4% | 11.9% |
| American Indian | 0.3% | 0.2% | 0.5% |
| Asian | 5.9% | 9.0% | 5.9% |
| Hawaiian | 0.1% | 0.0% | 0.2% |
| Other | 3.3% | 1.0% | 0.6% |
| Two Or More | 11.6% | 3.8% | 4.3% |
| Hispanic | 12.7% | 19.8% | 19.3% |
Gender in Schenectady
See the full breakdown
Schenectady is 50.8% female with 34,994 female residents.
Schenectady is 49.2% male with 33,853 male residents.
| Gender | Schenectady | NY | USA |
|---|---|---|---|
| Female | 50.8% | 51.2% | 50.5% |
| Male | 49.2% | 48.8% | 49.5% |
Highest level of educational attainment in Schenectady for adults over 25
See the full breakdown
5.0% of adults in Schenectady completed < 9th grade.
9.0% of adults in Schenectady completed 9-12th grade.
29.0% of adults in Schenectady completed high school / ged.
19.0% of adults in Schenectady completed some college.
12.0% of adults in Schenectady completed associate's degree.
15.0% of adults in Schenectady completed bachelor's degree.
8.0% of adults in Schenectady completed master's degree.
2.0% of adults in Schenectady completed professional degree.
1.0% of adults in Schenectady completed doctorate degree.
| Education | Schenectady | NY | USA |
|---|---|---|---|
| < 9th Grade | 5.0% | 6.0% | 4.0% |
| 9-12th Grade | 9.0% | 6.0% | 6.0% |
| High School / GED | 29.0% | 24.0% | 26.0% |
| Some College | 19.0% | 15.0% | 19.0% |
| Associate's Degree | 12.0% | 9.0% | 9.0% |
| Bachelor's Degree | 15.0% | 22.0% | 22.0% |
| Master's Degree | 8.0% | 13.0% | 10.0% |
| Professional Degree | 2.0% | 3.0% | 2.0% |
| Doctorate Degree | 1.0% | 2.0% | 2.0% |
Household Income For Schenectady, New York
See the full breakdown
10.2% of households in Schenectady earn Less than $10,000.
5.5% of households in Schenectady earn $10,000 to $14,999.
9.1% of households in Schenectady earn $15,000 to $24,999.
7.3% of households in Schenectady earn $25,000 to $34,999.
11.1% of households in Schenectady earn $35,000 to $49,999.
19.0% of households in Schenectady earn $50,000 to $74,999.
12.8% of households in Schenectady earn $75,000 to $99,999.
13.5% of households in Schenectady earn $100,000 to $149,999.
6.1% of households in Schenectady earn $150,000 to $199,999.
5.3% of households in Schenectady earn $200,000 or more.
| Income | Schenectady | NY | USA |
|---|---|---|---|
| Less than $10,000 | 10.2% | 5.8% | 5.0% |
| $10,000 to $14,999 | 5.5% | 3.9% | 3.4% |
| $15,000 to $24,999 | 9.1% | 6.3% | 6.3% |
| $25,000 to $34,999 | 7.3% | 6.2% | 6.6% |
| $35,000 to $49,999 | 11.1% | 8.9% | 10.1% |
| $50,000 to $74,999 | 19.0% | 13.6% | 15.5% |
| $75,000 to $99,999 | 12.8% | 11.4% | 12.6% |
| $100,000 to $149,999 | 13.5% | 16.7% | 17.5% |
| $150,000 to $199,999 | 6.1% | 10.1% | 9.6% |
| $200,000 or more | 5.3% | 17.1% | 13.4% |
Source: U.S. Census ACS 5-year estimates (2024)


