Yonkers SnackAbility
Overall SnackAbility
Crime in Yonkers summary. We use data from the FBI to determine the crime rates in Yonkers. Key points include:
There were 2,740 total crimes in Yonkers in the last reporting year.
The overall crime rate per 100,000 people in Yonkers is 1,326.5 / 100k people.
The violent crime rate per 100,000 people in Yonkers is 311.8 / 100k people.
The property crime rate per 100,000 people in Yonkers is 1,014.7 / 100k people.
Overall, crime in Yonkers is -37.41% below the national average.
Total Crimes
Below National Average
Crime In Yonkers Comparison Table
| Statistic | Count Raw |
Yonkers / 100k People |
New York / 100k People |
National / 100k People |
|---|---|---|---|---|
| Total Crimes Per 100K | 2,740 | 1,326.5 | 2,099.7 | 2,119.2 |
| Violent Crime | 644 | 311.8 | 380.2 | 359.0 |
| Murder | 4 | 1.9 | 2.7 | 5.0 |
| Robbery | 131 | 63.4 | 96.1 | 61.0 |
| Aggravated Assault | 490 | 237.2 | 259.6 | 256.0 |
| Property Crime | 2,096 | 1,014.7 | 1,719.5 | 1,760.0 |
| Burglary | 244 | 118.1 | 136.6 | 229.0 |
| Larceny | 1,533 | 742.2 | 1,432.8 | 1,272.0 |
| Car Theft | 319 | 154.4 | 150.2 | 259.0 |
Source: FBI Uniform Crime Reporting (2024)
Cost of living in Yonkers summary. We use data on the cost of living to determine how expensive it is to live in Yonkers. Real estate prices drive most of the variance in cost of living around New York. Key points include:
The cost of living in Yonkers is 142 with 100 being average.
The cost of living in Yonkers is 1.4x higher than the national average.
The median home value in Yonkers is $680,217.
The median income in Yonkers is $83,549.
Yonkers's Overall Cost Of Living
Higher Than The National Average
Cost Of Living In Yonkers Comparison Table
| Living Expense | Yonkers | New York | National Average |
|---|---|---|---|
| Overall | 142 | 121 | 100 |
| Services | 109 | 105 | 100 |
| Groceries | 113 | 108 | 100 |
| Health | 209 | 143 | 100 |
| Housing | 117 | 112 | 100 |
| Transportation | 111 | 114 | 100 |
| Utilities | 119 | 111 | 100 |
Source: Cost of living index, normalized to US average = 100
Yonkers, NY Weather
The average high in Yonkers is 62.2° and the average low is 45.5°.
There are 80.9 days of precipitation each year.
Expect an average of 48.2 inches of precipitation each year with 28.6 inches of snow.
| Stat | Yonkers |
|---|---|
| Average Annual High | 62.2 |
| Average Annual Low | 45.5 |
| Annual Precipitation Days | 80.9 |
| Average Annual Precipitation | 48.2 |
| Average Annual Snowfall | 28.6 |
Average High
Days of Rain
Source: NOAA climate normals (30-year)
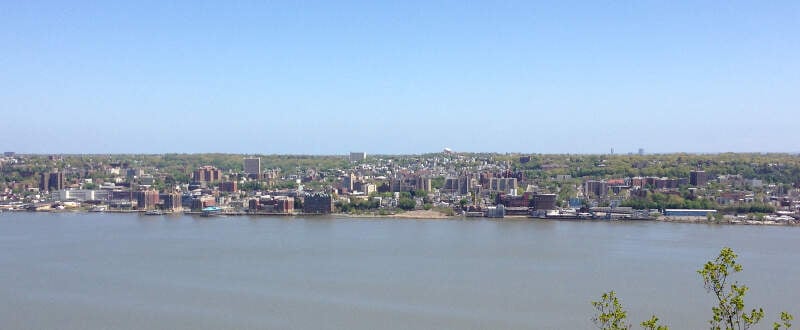
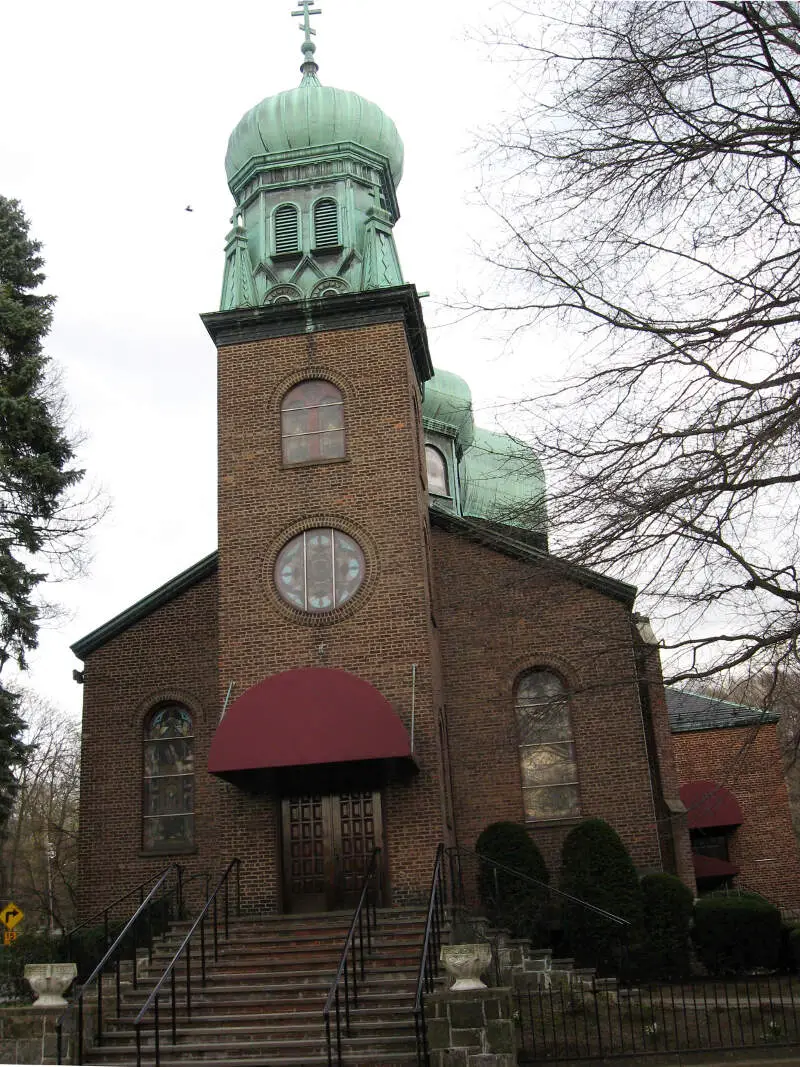
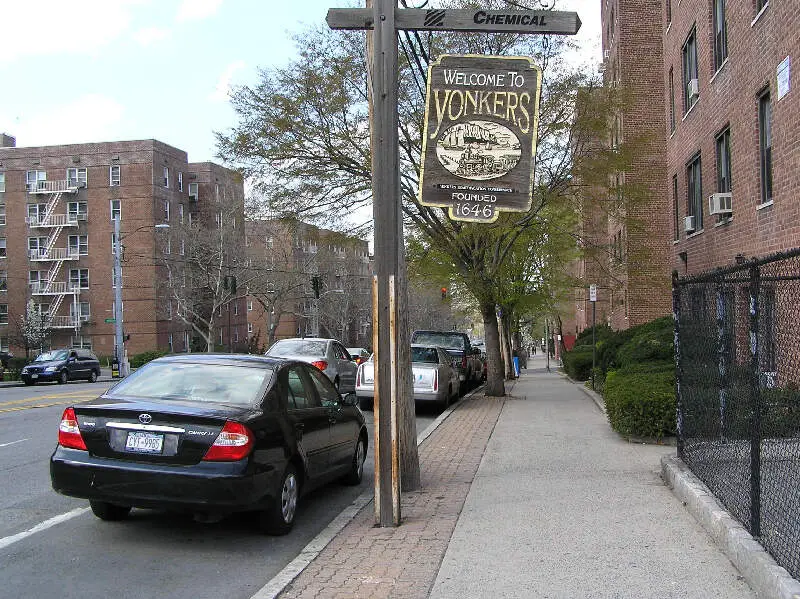
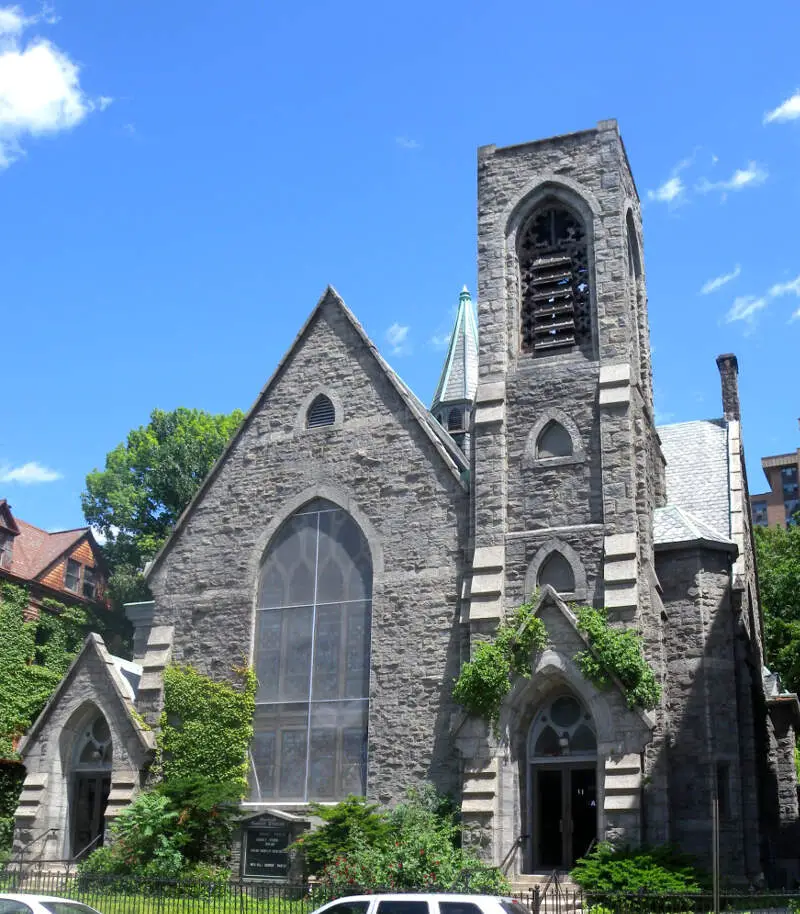
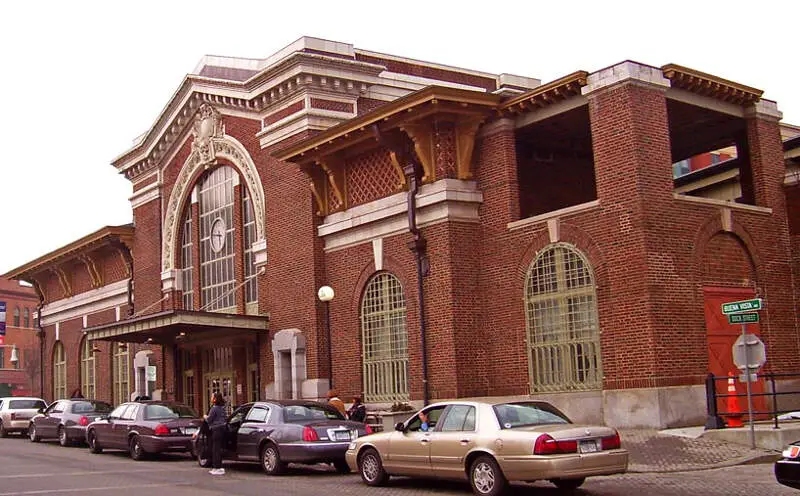
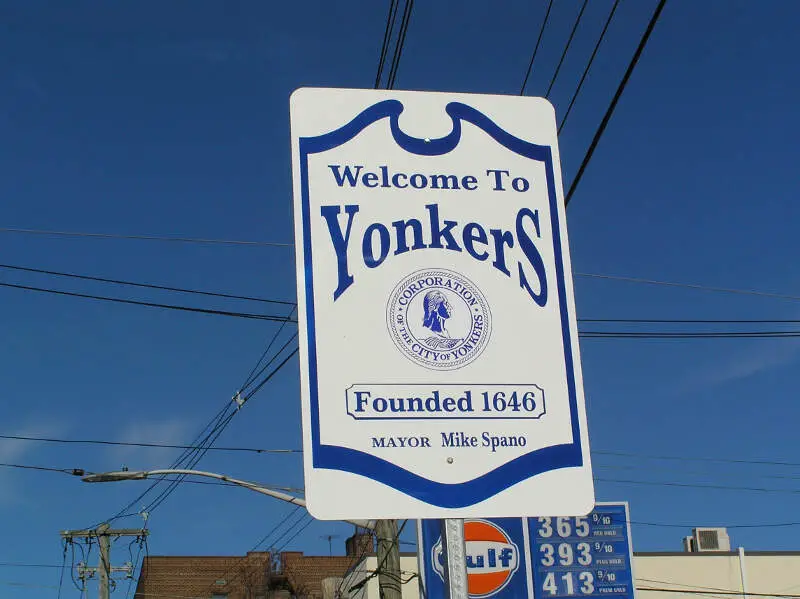
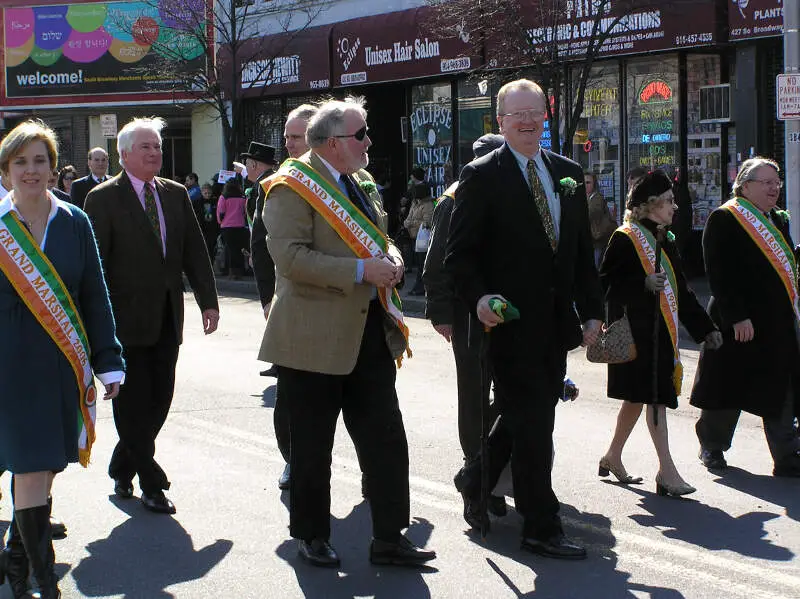
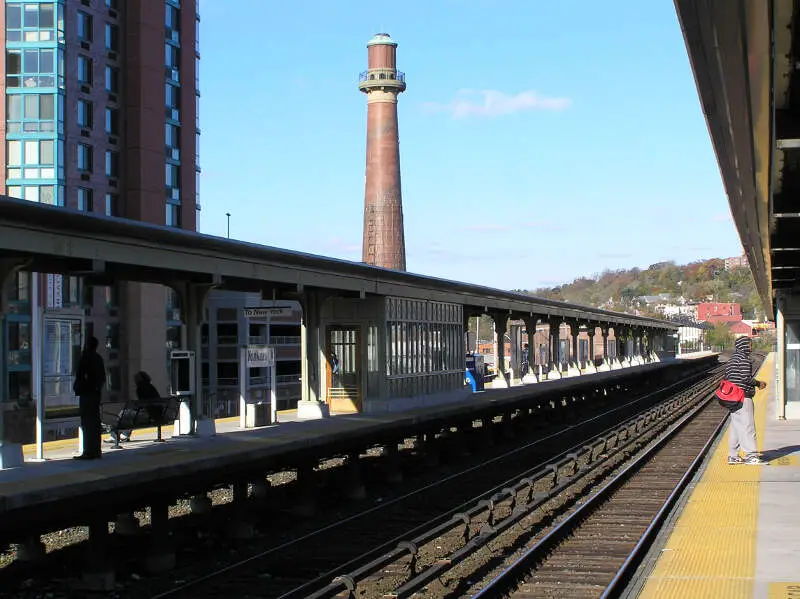
Yonkers, NY Photos

1 Reviews & Comments About Yonkers

High crime. Not safe. Schools are low-ranking. Nothing to do there.
Do not go out at night. Chances are you will be mugged.
Rankings & Articles For Yonkers


Locations Around Yonkers
Map Of Yonkers, NY
Best Places Around Yonkers
Bronxville, NY
Population 6,510
Pelham Manor, NY
Population 5,644
North New Hyde Park, NY
Population 14,159
East Hills, NY
Population 7,257
Pleasantville, NY
Population 7,371
Larchmont, NY
Population 6,567
Williston Park, NY
Population 7,542
Briarcliff Manor, NY
Population 7,519
Port Washington, NY
Population 18,004
Yonkers Demographics And Statistics
Population over time in Yonkers
The current population in Yonkers is 209,978. The population has increased 7.7% from 2010.
| Year | Population | % Change |
|---|---|---|
| 2024 | 209,978 | 0.2% |
| 2023 | 209,529 | -0.1% |
| 2022 | 209,780 | 0.0% |
| 2021 | 209,730 | 4.8% |
| 2020 | 200,183 | 0.1% |
| 2019 | 199,968 | 0.1% |
| 2018 | 199,745 | -0.6% |
| 2017 | 200,999 | 0.6% |
| 2016 | 199,725 | 0.1% |
| 2015 | 199,435 | 0.4% |
| 2014 | 198,654 | 0.6% |
| 2013 | 197,493 | 0.5% |
| 2012 | 196,459 | 0.5% |
| 2011 | 195,506 | 0.3% |
| 2010 | 194,880 | - |
Race / Ethnicity in Yonkers
See the full breakdown
Yonkers is:
30.9% White with 64,879 White residents.
14.6% African American with 30,732 African American residents.
0.2% American Indian with 315 American Indian residents.
5.3% Asian with 11,130 Asian residents.
0.0% Hawaiian with 17 Hawaiian residents.
1.5% Other with 3,201 Other residents.
2.3% Two Or More with 4,802 Two Or More residents.
45.2% Hispanic with 94,902 Hispanic residents.
| Race | Yonkers | NY | USA |
|---|---|---|---|
| White | 30.9% | 52.8% | 57.4% |
| African American | 14.6% | 13.4% | 11.9% |
| American Indian | 0.2% | 0.2% | 0.5% |
| Asian | 5.3% | 9.0% | 5.9% |
| Hawaiian | 0.0% | 0.0% | 0.2% |
| Other | 1.5% | 1.0% | 0.6% |
| Two Or More | 2.3% | 3.8% | 4.3% |
| Hispanic | 45.2% | 19.8% | 19.3% |
Gender in Yonkers
See the full breakdown
Yonkers is 51.6% female with 108,414 female residents.
Yonkers is 48.4% male with 101,564 male residents.
| Gender | Yonkers | NY | USA |
|---|---|---|---|
| Female | 51.6% | 51.2% | 50.5% |
| Male | 48.4% | 48.8% | 49.5% |
Highest level of educational attainment in Yonkers for adults over 25
See the full breakdown
9.0% of adults in Yonkers completed < 9th grade.
8.0% of adults in Yonkers completed 9-12th grade.
25.0% of adults in Yonkers completed high school / ged.
16.0% of adults in Yonkers completed some college.
7.0% of adults in Yonkers completed associate's degree.
20.0% of adults in Yonkers completed bachelor's degree.
12.0% of adults in Yonkers completed master's degree.
2.0% of adults in Yonkers completed professional degree.
1.0% of adults in Yonkers completed doctorate degree.
| Education | Yonkers | NY | USA |
|---|---|---|---|
| < 9th Grade | 9.0% | 6.0% | 4.0% |
| 9-12th Grade | 8.0% | 6.0% | 6.0% |
| High School / GED | 25.0% | 24.0% | 26.0% |
| Some College | 16.0% | 15.0% | 19.0% |
| Associate's Degree | 7.0% | 9.0% | 9.0% |
| Bachelor's Degree | 20.0% | 22.0% | 22.0% |
| Master's Degree | 12.0% | 13.0% | 10.0% |
| Professional Degree | 2.0% | 3.0% | 2.0% |
| Doctorate Degree | 1.0% | 2.0% | 2.0% |
Household Income For Yonkers, New York
See the full breakdown
6.7% of households in Yonkers earn Less than $10,000.
3.7% of households in Yonkers earn $10,000 to $14,999.
6.5% of households in Yonkers earn $15,000 to $24,999.
5.6% of households in Yonkers earn $25,000 to $34,999.
9.1% of households in Yonkers earn $35,000 to $49,999.
14.7% of households in Yonkers earn $50,000 to $74,999.
11.1% of households in Yonkers earn $75,000 to $99,999.
17.2% of households in Yonkers earn $100,000 to $149,999.
10.2% of households in Yonkers earn $150,000 to $199,999.
15.3% of households in Yonkers earn $200,000 or more.
| Income | Yonkers | NY | USA |
|---|---|---|---|
| Less than $10,000 | 6.7% | 5.8% | 5.0% |
| $10,000 to $14,999 | 3.7% | 3.9% | 3.4% |
| $15,000 to $24,999 | 6.5% | 6.3% | 6.3% |
| $25,000 to $34,999 | 5.6% | 6.2% | 6.6% |
| $35,000 to $49,999 | 9.1% | 8.9% | 10.1% |
| $50,000 to $74,999 | 14.7% | 13.6% | 15.5% |
| $75,000 to $99,999 | 11.1% | 11.4% | 12.6% |
| $100,000 to $149,999 | 17.2% | 16.7% | 17.5% |
| $150,000 to $199,999 | 10.2% | 10.1% | 9.6% |
| $200,000 or more | 15.3% | 17.1% | 13.4% |
Source: U.S. Census ACS 5-year estimates (2024)


