Amherst SnackAbility
Overall SnackAbility
Crime in Amherst summary. We use data from the FBI to determine the crime rates in Amherst. Key points include:
There were 161 total crimes in Amherst in the last reporting year.
The overall crime rate per 100,000 people in Amherst is 1,238.8 / 100k people.
The violent crime rate per 100,000 people in Amherst is 238.5 / 100k people.
The property crime rate per 100,000 people in Amherst is 1,000.3 / 100k people.
Overall, crime in Amherst is -41.54% below the national average.
Total Crimes
Below National Average
Crime In Amherst Comparison Table
| Statistic | Count Raw |
Amherst / 100k People |
Ohio / 100k People |
National / 100k People |
|---|---|---|---|---|
| Total Crimes Per 100K | 161 | 1,238.8 | 1,844.9 | 2,119.2 |
| Violent Crime | 31 | 238.5 | 293.7 | 359.0 |
| Murder | 0 | 0.0 | 5.0 | 5.0 |
| Robbery | 3 | 23.1 | 45.5 | 61.0 |
| Aggravated Assault | 26 | 200.1 | 197.4 | 256.0 |
| Property Crime | 130 | 1,000.3 | 1,551.2 | 1,760.0 |
| Burglary | 5 | 38.5 | 206.0 | 229.0 |
| Larceny | 123 | 946.4 | 1,132.8 | 1,272.0 |
| Car Theft | 2 | 15.4 | 212.5 | 259.0 |
Source: FBI Uniform Crime Reporting (2024)
Cost of living in Amherst summary. We use data on the cost of living to determine how expensive it is to live in Amherst. Real estate prices drive most of the variance in cost of living around Ohio. Key points include:
The cost of living in Amherst is 91 with 100 being average.
The cost of living in Amherst is 0.9x lower than the national average.
The median home value in Amherst is $274,430.
The median income in Amherst is $90,725.
Amherst's Overall Cost Of Living
Lower Than The National Average
Cost Of Living In Amherst Comparison Table
| Living Expense | Amherst | Ohio | National Average |
|---|---|---|---|
| Overall | 91 | 90 | 100 |
| Services | 94 | 97 | 100 |
| Groceries | 93 | 97 | 100 |
| Health | 86 | 75 | 100 |
| Housing | 95 | 97 | 100 |
| Transportation | 94 | 95 | 100 |
| Utilities | 98 | 97 | 100 |
Source: Cost of living index, normalized to US average = 100
Amherst, OH Weather
The average high in Amherst is 59.5° and the average low is 42.6°.
There are 83.5 days of precipitation each year.
Expect an average of 37.5 inches of precipitation each year with 47.9 inches of snow.
| Stat | Amherst |
|---|---|
| Average Annual High | 59.5 |
| Average Annual Low | 42.6 |
| Annual Precipitation Days | 83.5 |
| Average Annual Precipitation | 37.5 |
| Average Annual Snowfall | 47.9 |
Average High
Days of Rain
Source: NOAA climate normals (30-year)
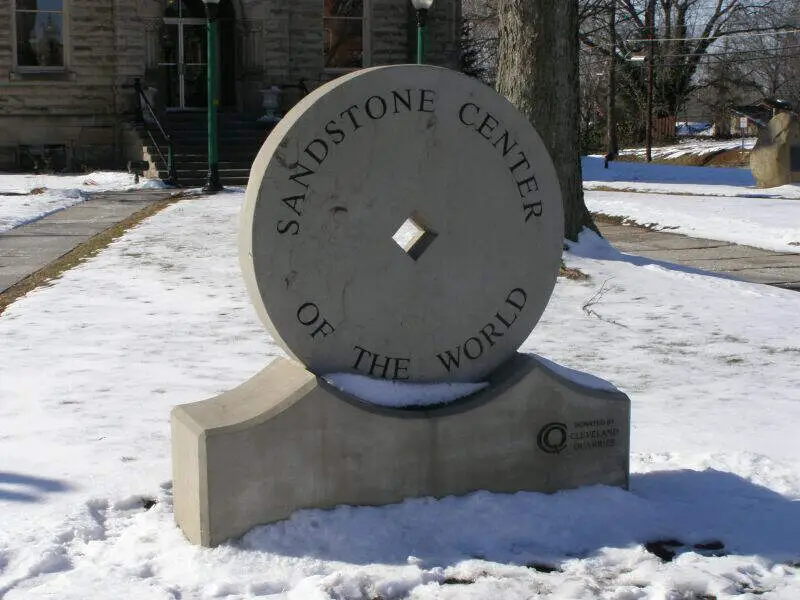
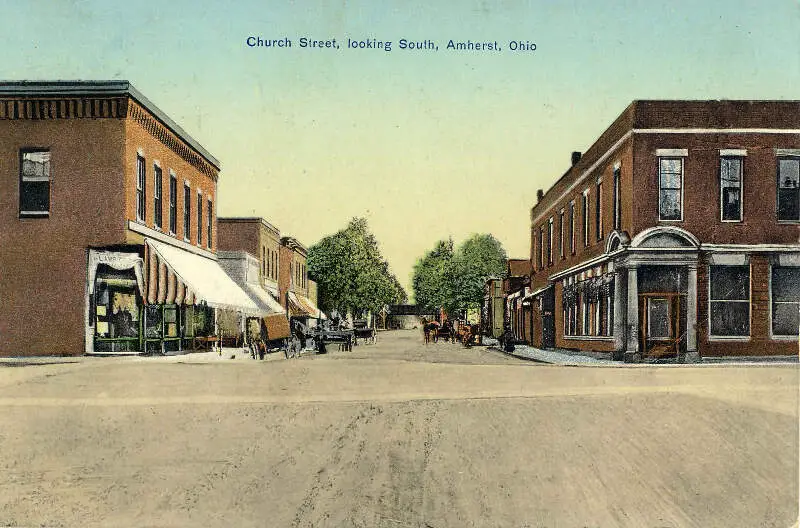
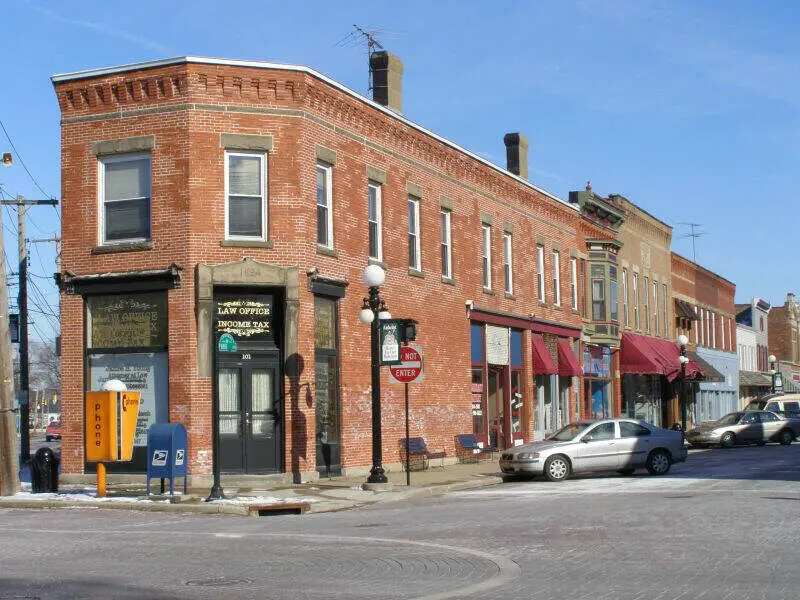
Amherst, OH Photos
Rankings & Articles For Amherst


Locations Around Amherst
Map Of Amherst, OH
Best Places Around Amherst
Westlake, OH
Population 34,104
North Olmsted, OH
Population 31,924
North Ridgeville, OH
Population 36,627
Avon Lake, OH
Population 25,752
Olmsted Falls, OH
Population 8,639
Fairview Park, OH
Population 17,018
Huron, OH
Population 6,757
Avon, OH
Population 25,317
Berea, OH
Population 18,218
Grafton, OH
Population 5,657
Amherst Demographics And Statistics
Population over time in Amherst
The current population in Amherst is 12,906. The population has increased 7.3% from 2010.
| Year | Population | % Change |
|---|---|---|
| 2024 | 12,906 | 0.9% |
| 2023 | 12,796 | 0.4% |
| 2022 | 12,740 | 0.6% |
| 2021 | 12,665 | 3.9% |
| 2020 | 12,193 | 0.7% |
| 2019 | 12,108 | 0.1% |
| 2018 | 12,097 | 0.1% |
| 2017 | 12,086 | 0.2% |
| 2016 | 12,058 | -0.5% |
| 2015 | 12,114 | 0.3% |
| 2014 | 12,080 | 0.2% |
| 2013 | 12,057 | 0.0% |
| 2012 | 12,056 | 0.1% |
| 2011 | 12,038 | 0.1% |
| 2010 | 12,031 | - |
Race / Ethnicity in Amherst
See the full breakdown
Amherst is:
86.1% White with 11,108 White residents.
1.7% African American with 215 African American residents.
0.0% American Indian with 6 American Indian residents.
2.1% Asian with 274 Asian residents.
0.0% Hawaiian with 0 Hawaiian residents.
0.1% Other with 11 Other residents.
3.1% Two Or More with 394 Two Or More residents.
7.0% Hispanic with 898 Hispanic residents.
| Race | Amherst | OH | USA |
|---|---|---|---|
| White | 86.1% | 75.8% | 57.4% |
| African American | 1.7% | 12.0% | 11.9% |
| American Indian | 0.0% | 0.1% | 0.5% |
| Asian | 2.1% | 2.5% | 5.9% |
| Hawaiian | 0.0% | 0.0% | 0.2% |
| Other | 0.1% | 0.4% | 0.6% |
| Two Or More | 3.1% | 4.3% | 4.3% |
| Hispanic | 7.0% | 4.8% | 19.3% |
Gender in Amherst
See the full breakdown
Amherst is 51.6% female with 6,655 female residents.
Amherst is 48.4% male with 6,250 male residents.
| Gender | Amherst | OH | USA |
|---|---|---|---|
| Female | 51.6% | 50.7% | 50.5% |
| Male | 48.4% | 49.3% | 49.5% |
Highest level of educational attainment in Amherst for adults over 25
See the full breakdown
1.0% of adults in Amherst completed < 9th grade.
4.0% of adults in Amherst completed 9-12th grade.
27.0% of adults in Amherst completed high school / ged.
25.0% of adults in Amherst completed some college.
12.0% of adults in Amherst completed associate's degree.
20.0% of adults in Amherst completed bachelor's degree.
9.0% of adults in Amherst completed master's degree.
1.0% of adults in Amherst completed professional degree.
1.0% of adults in Amherst completed doctorate degree.
| Education | Amherst | OH | USA |
|---|---|---|---|
| < 9th Grade | 1.0% | 3.0% | 4.0% |
| 9-12th Grade | 4.0% | 6.0% | 6.0% |
| High School / GED | 27.0% | 32.0% | 26.0% |
| Some College | 25.0% | 19.0% | 19.0% |
| Associate's Degree | 12.0% | 9.0% | 9.0% |
| Bachelor's Degree | 20.0% | 19.0% | 22.0% |
| Master's Degree | 9.0% | 9.0% | 10.0% |
| Professional Degree | 1.0% | 2.0% | 2.0% |
| Doctorate Degree | 1.0% | 1.0% | 2.0% |
Household Income For Amherst, Ohio
See the full breakdown
1.6% of households in Amherst earn Less than $10,000.
1.4% of households in Amherst earn $10,000 to $14,999.
6.3% of households in Amherst earn $15,000 to $24,999.
5.3% of households in Amherst earn $25,000 to $34,999.
9.2% of households in Amherst earn $35,000 to $49,999.
18.0% of households in Amherst earn $50,000 to $74,999.
11.7% of households in Amherst earn $75,000 to $99,999.
21.0% of households in Amherst earn $100,000 to $149,999.
13.7% of households in Amherst earn $150,000 to $199,999.
12.0% of households in Amherst earn $200,000 or more.
| Income | Amherst | OH | USA |
|---|---|---|---|
| Less than $10,000 | 1.6% | 5.2% | 5.0% |
| $10,000 to $14,999 | 1.4% | 4.0% | 3.4% |
| $15,000 to $24,999 | 6.3% | 7.1% | 6.3% |
| $25,000 to $34,999 | 5.3% | 7.5% | 6.6% |
| $35,000 to $49,999 | 9.2% | 11.6% | 10.1% |
| $50,000 to $74,999 | 18.0% | 16.9% | 15.5% |
| $75,000 to $99,999 | 11.7% | 13.1% | 12.6% |
| $100,000 to $149,999 | 21.0% | 17.1% | 17.5% |
| $150,000 to $199,999 | 13.7% | 8.3% | 9.6% |
| $200,000 or more | 12.0% | 9.1% | 13.4% |
Source: U.S. Census ACS 5-year estimates (2024)


