Berea SnackAbility
Overall SnackAbility
Crime in Berea summary. We use data from the FBI to determine the crime rates in Berea. Key points include:
There were 71 total crimes in Berea in the last reporting year.
The overall crime rate per 100,000 people in Berea is 397.0 / 100k people.
The violent crime rate per 100,000 people in Berea is 22.4 / 100k people.
The property crime rate per 100,000 people in Berea is 374.6 / 100k people.
Overall, crime in Berea is -81.27% below the national average.
Total Crimes
Below National Average
Crime In Berea Comparison Table
| Statistic | Count Raw |
Berea / 100k People |
Ohio / 100k People |
National / 100k People |
|---|---|---|---|---|
| Total Crimes Per 100K | 71 | 397.0 | 1,844.9 | 2,119.2 |
| Violent Crime | 4 | 22.4 | 293.7 | 359.0 |
| Murder | 0 | 0.0 | 5.0 | 5.0 |
| Robbery | 0 | 0.0 | 45.5 | 61.0 |
| Aggravated Assault | 4 | 22.4 | 197.4 | 256.0 |
| Property Crime | 67 | 374.6 | 1,551.2 | 1,760.0 |
| Burglary | 10 | 55.9 | 206.0 | 229.0 |
| Larceny | 56 | 313.1 | 1,132.8 | 1,272.0 |
| Car Theft | 1 | 5.6 | 212.5 | 259.0 |
Source: FBI Uniform Crime Reporting (2024)
Cost of living in Berea summary. We use data on the cost of living to determine how expensive it is to live in Berea. Real estate prices drive most of the variance in cost of living around Ohio. Key points include:
The cost of living in Berea is 93 with 100 being average.
The cost of living in Berea is 0.9x lower than the national average.
The median home value in Berea is $239,039.
The median income in Berea is $74,926.
Berea's Overall Cost Of Living
Lower Than The National Average
Cost Of Living In Berea Comparison Table
| Living Expense | Berea | Ohio | National Average |
|---|---|---|---|
| Overall | 93 | 90 | 100 |
| Services | 96 | 97 | 100 |
| Groceries | 99 | 97 | 100 |
| Health | 82 | 75 | 100 |
| Housing | 94 | 97 | 100 |
| Transportation | 94 | 95 | 100 |
| Utilities | 98 | 97 | 100 |
Source: Cost of living index, normalized to US average = 100
Berea, OH Weather
The average high in Berea is 59.4° and the average low is 42.0°.
There are 87.2 days of precipitation each year.
Expect an average of 39.0 inches of precipitation each year with 60.8 inches of snow.
| Stat | Berea |
|---|---|
| Average Annual High | 59.4 |
| Average Annual Low | 42.0 |
| Annual Precipitation Days | 87.2 |
| Average Annual Precipitation | 39.0 |
| Average Annual Snowfall | 60.8 |
Average High
Days of Rain
Source: NOAA climate normals (30-year)
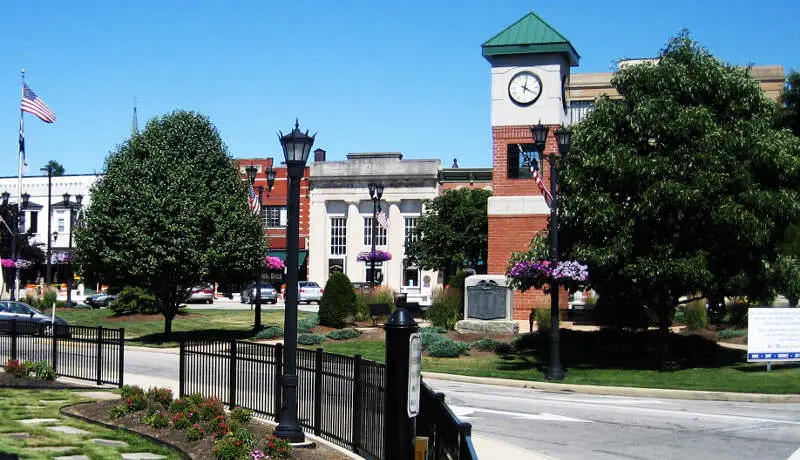
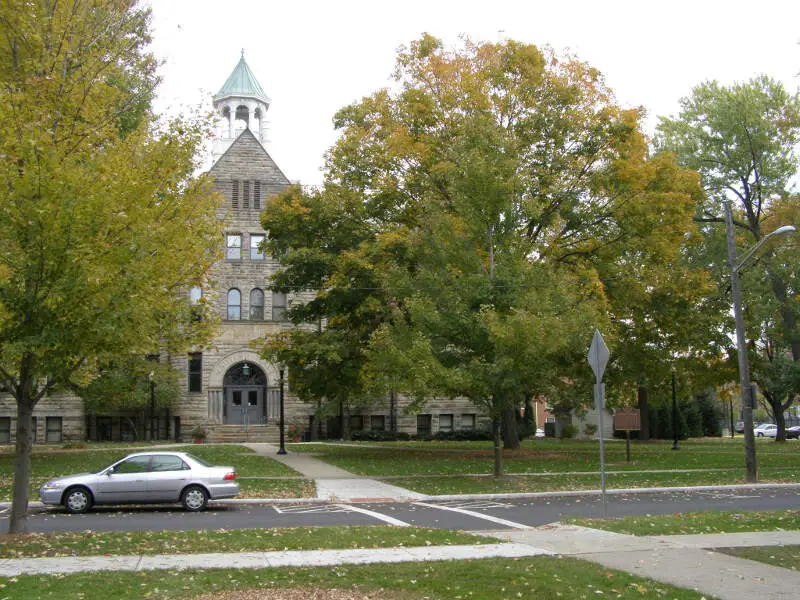
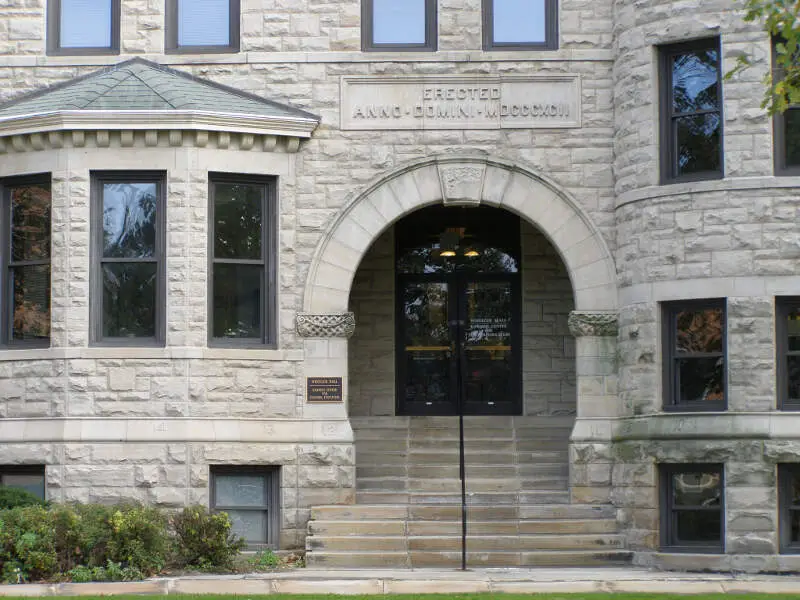
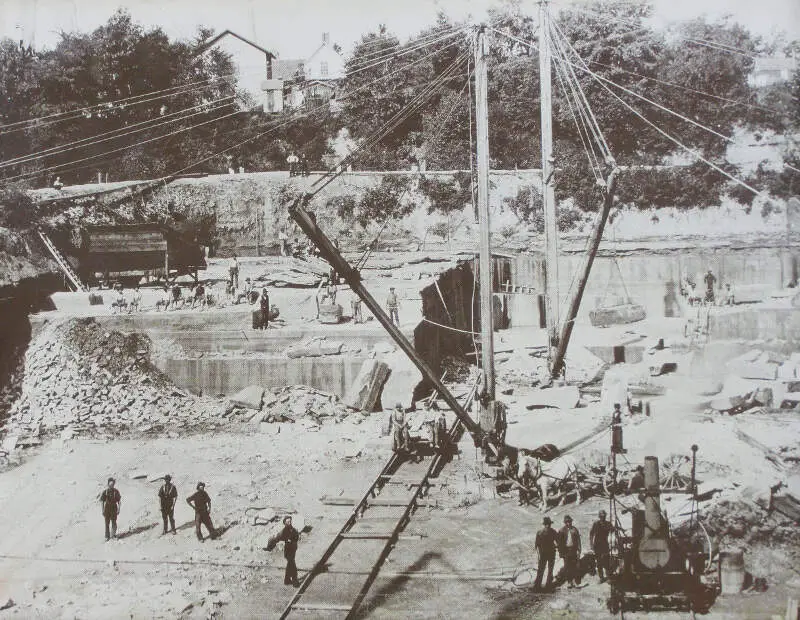
Berea, OH Photos
Rankings & Articles For Berea


Locations Around Berea
Map Of Berea, OH
Best Places Around Berea
Shaker Heights, OH
Population 28,922
Westlake, OH
Population 34,104
Macedonia, OH
Population 12,152
North Olmsted, OH
Population 31,924
Broadview Heights, OH
Population 19,771
Strongsville, OH
Population 45,983
Rocky River, OH
Population 21,490
Seven Hills, OH
Population 11,603
Oakwood, OH
Population 9,458
North Ridgeville, OH
Population 36,627
Berea Demographics And Statistics
Population over time in Berea
The current population in Berea is 18,218. The population has decreased 4.0% from 2010.
| Year | Population | % Change |
|---|---|---|
| 2024 | 18,218 | -0.6% |
| 2023 | 18,330 | -1.2% |
| 2022 | 18,550 | -0.9% |
| 2021 | 18,724 | 0.1% |
| 2020 | 18,713 | -0.4% |
| 2019 | 18,788 | -0.4% |
| 2018 | 18,859 | -0.4% |
| 2017 | 18,934 | -0.1% |
| 2016 | 18,949 | -0.3% |
| 2015 | 19,001 | -0.2% |
| 2014 | 19,044 | -0.1% |
| 2013 | 19,072 | 0.1% |
| 2012 | 19,049 | 0.3% |
| 2011 | 18,996 | 0.1% |
| 2010 | 18,981 | - |
Race / Ethnicity in Berea
See the full breakdown
Berea is:
79.5% White with 14,476 White residents.
8.0% African American with 1,453 African American residents.
0.0% American Indian with 9 American Indian residents.
1.3% Asian with 234 Asian residents.
0.4% Hawaiian with 81 Hawaiian residents.
0.5% Other with 98 Other residents.
6.3% Two Or More with 1,140 Two Or More residents.
4.0% Hispanic with 727 Hispanic residents.
| Race | Berea | OH | USA |
|---|---|---|---|
| White | 79.5% | 75.8% | 57.4% |
| African American | 8.0% | 12.0% | 11.9% |
| American Indian | 0.0% | 0.1% | 0.5% |
| Asian | 1.3% | 2.5% | 5.9% |
| Hawaiian | 0.4% | 0.0% | 0.2% |
| Other | 0.5% | 0.4% | 0.6% |
| Two Or More | 6.3% | 4.3% | 4.3% |
| Hispanic | 4.0% | 4.8% | 19.3% |
Gender in Berea
See the full breakdown
Berea is 50.3% female with 9,161 female residents.
Berea is 49.7% male with 9,057 male residents.
| Gender | Berea | OH | USA |
|---|---|---|---|
| Female | 50.3% | 50.7% | 50.5% |
| Male | 49.7% | 49.3% | 49.5% |
Highest level of educational attainment in Berea for adults over 25
See the full breakdown
0.0% of adults in Berea completed < 9th grade.
4.0% of adults in Berea completed 9-12th grade.
27.0% of adults in Berea completed high school / ged.
23.0% of adults in Berea completed some college.
9.0% of adults in Berea completed associate's degree.
22.0% of adults in Berea completed bachelor's degree.
13.0% of adults in Berea completed master's degree.
1.0% of adults in Berea completed professional degree.
1.0% of adults in Berea completed doctorate degree.
| Education | Berea | OH | USA |
|---|---|---|---|
| < 9th Grade | 0.0% | 3.0% | 4.0% |
| 9-12th Grade | 4.0% | 6.0% | 6.0% |
| High School / GED | 27.0% | 32.0% | 26.0% |
| Some College | 23.0% | 19.0% | 19.0% |
| Associate's Degree | 9.0% | 9.0% | 9.0% |
| Bachelor's Degree | 22.0% | 19.0% | 22.0% |
| Master's Degree | 13.0% | 9.0% | 10.0% |
| Professional Degree | 1.0% | 2.0% | 2.0% |
| Doctorate Degree | 1.0% | 1.0% | 2.0% |
Household Income For Berea, Ohio
See the full breakdown
4.1% of households in Berea earn Less than $10,000.
1.0% of households in Berea earn $10,000 to $14,999.
6.2% of households in Berea earn $15,000 to $24,999.
8.5% of households in Berea earn $25,000 to $34,999.
11.7% of households in Berea earn $35,000 to $49,999.
18.6% of households in Berea earn $50,000 to $74,999.
14.2% of households in Berea earn $75,000 to $99,999.
18.3% of households in Berea earn $100,000 to $149,999.
10.3% of households in Berea earn $150,000 to $199,999.
7.1% of households in Berea earn $200,000 or more.
| Income | Berea | OH | USA |
|---|---|---|---|
| Less than $10,000 | 4.1% | 5.2% | 5.0% |
| $10,000 to $14,999 | 1.0% | 4.0% | 3.4% |
| $15,000 to $24,999 | 6.2% | 7.1% | 6.3% |
| $25,000 to $34,999 | 8.5% | 7.5% | 6.6% |
| $35,000 to $49,999 | 11.7% | 11.6% | 10.1% |
| $50,000 to $74,999 | 18.6% | 16.9% | 15.5% |
| $75,000 to $99,999 | 14.2% | 13.1% | 12.6% |
| $100,000 to $149,999 | 18.3% | 17.1% | 17.5% |
| $150,000 to $199,999 | 10.3% | 8.3% | 9.6% |
| $200,000 or more | 7.1% | 9.1% | 13.4% |
Source: U.S. Census ACS 5-year estimates (2024)


