Ashtabula SnackAbility
Overall SnackAbility
Cost of living in Ashtabula summary. We use data on the cost of living to determine how expensive it is to live in Ashtabula. Real estate prices drive most of the variance in cost of living around Ohio. Key points include:
The cost of living in Ashtabula is 82 with 100 being average.
The cost of living in Ashtabula is 0.8x lower than the national average.
The median home value in Ashtabula is $151,257.
The median income in Ashtabula is $44,120.
Ashtabula's Overall Cost Of Living
Lower Than The National Average
Cost Of Living In Ashtabula Comparison Table
| Living Expense | Ashtabula | Ohio | National Average |
|---|---|---|---|
| Overall | 82 | 90 | 100 |
| Services | 99 | 97 | 100 |
| Groceries | 95 | 97 | 100 |
| Health | 50 | 75 | 100 |
| Housing | 94 | 97 | 100 |
| Transportation | 94 | 95 | 100 |
| Utilities | 94 | 97 | 100 |
Source: Cost of living index, normalized to US average = 100
Ashtabula, OH Weather
The average high in Ashtabula is 58.4° and the average low is 39.4°.
There are 92.2 days of precipitation each year.
Expect an average of 41.9 inches of precipitation each year with 81.1 inches of snow.
| Stat | Ashtabula |
|---|---|
| Average Annual High | 58.4 |
| Average Annual Low | 39.4 |
| Annual Precipitation Days | 92.2 |
| Average Annual Precipitation | 41.9 |
| Average Annual Snowfall | 81.1 |
Average High
Days of Rain
Source: NOAA climate normals (30-year)
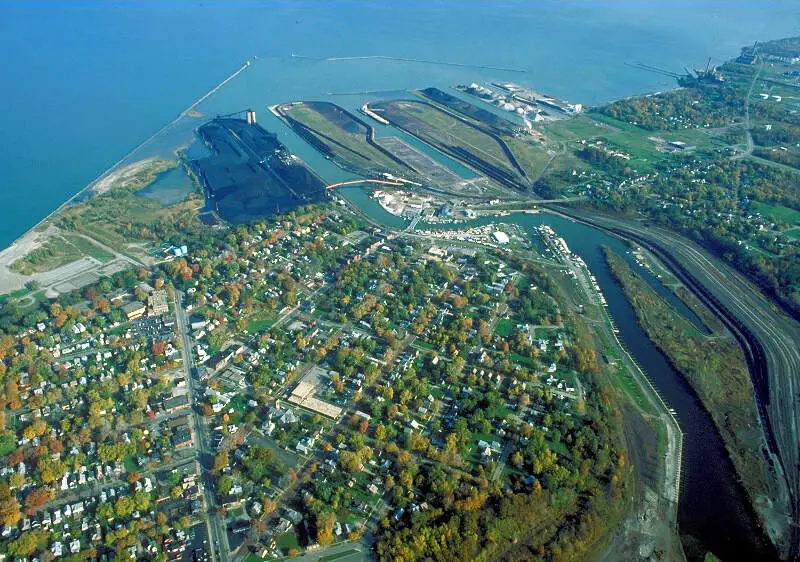
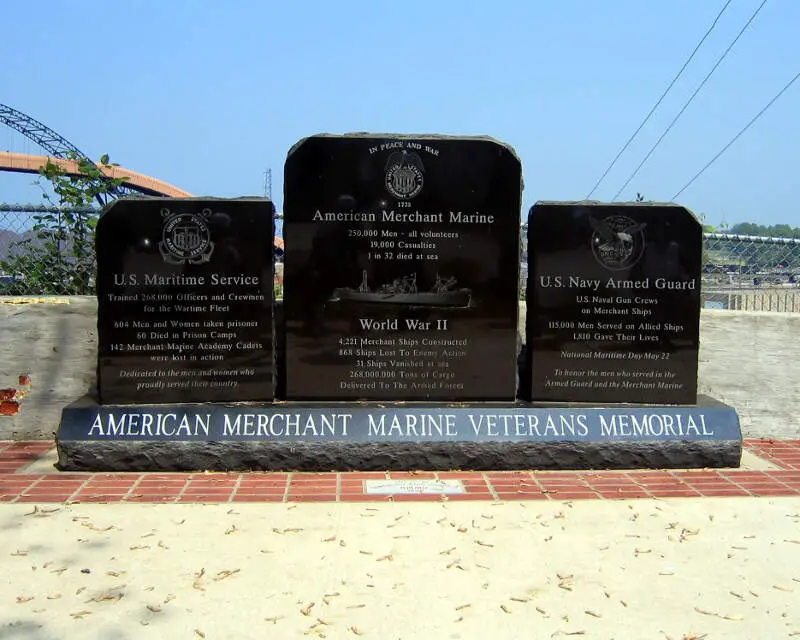
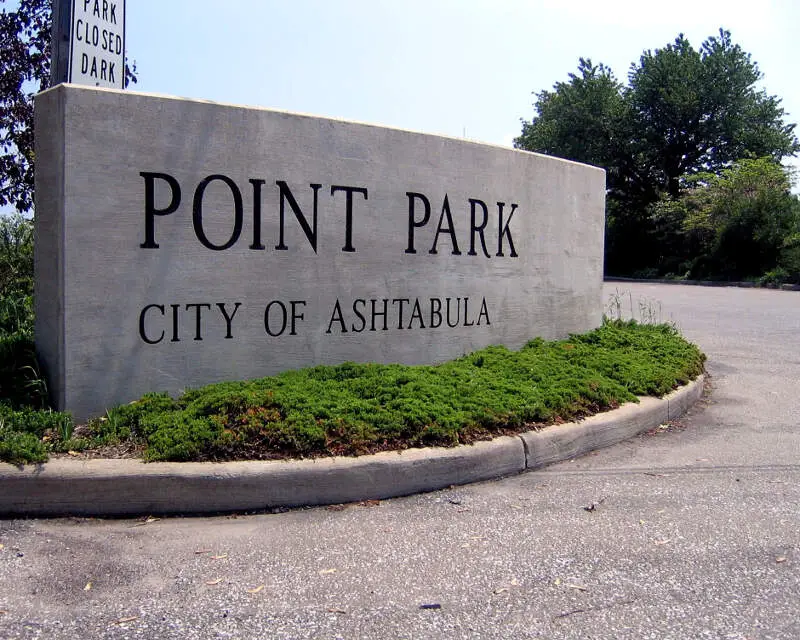
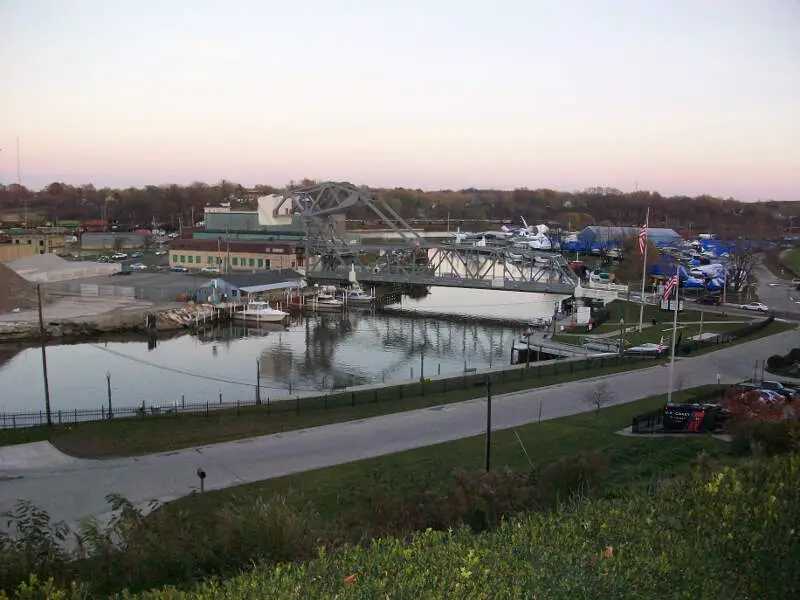
Ashtabula, OH Photos

1 Reviews & Comments About Ashtabula

I lived in Ashtabula for 60 plus years and moved away from the h**l hole and never looked back. Best thing anyone can do is get out of there. It will be the best day of your life."
Rankings & Articles For Ashtabula


Locations Around Ashtabula
Map Of Ashtabula, OH
Best Places Around Ashtabula
Shaker Heights, OH
Population 28,922
Highland Heights, OH
Population 8,623
Pepper Pike, OH
Population 6,840
Solon, OH
Population 23,943
Aurora, OH
Population 17,581
Lyndhurst, OH
Population 13,801
Beachwood, OH
Population 13,865
University Heights, OH
Population 13,394
Kirtland, OH
Population 6,911
Cleveland Heights, OH
Population 44,497
Ashtabula Demographics And Statistics
Population over time in Ashtabula
The current population in Ashtabula is 17,856. The population has decreased 8.5% from 2010.
| Year | Population | % Change |
|---|---|---|
| 2024 | 17,856 | -0.4% |
| 2023 | 17,919 | -0.5% |
| 2022 | 18,003 | -0.5% |
| 2021 | 18,091 | 0.1% |
| 2020 | 18,067 | -0.6% |
| 2019 | 18,171 | -0.4% |
| 2018 | 18,243 | -0.8% |
| 2017 | 18,385 | -0.8% |
| 2016 | 18,540 | -0.7% |
| 2015 | 18,663 | -0.8% |
| 2014 | 18,819 | -0.8% |
| 2013 | 18,976 | -0.9% |
| 2012 | 19,144 | -1.0% |
| 2011 | 19,345 | -0.8% |
| 2010 | 19,508 | - |
Race / Ethnicity in Ashtabula
See the full breakdown
Ashtabula is:
70.1% White with 12,511 White residents.
8.5% African American with 1,525 African American residents.
0.0% American Indian with 0 American Indian residents.
0.5% Asian with 95 Asian residents.
0.0% Hawaiian with 0 Hawaiian residents.
1.0% Other with 182 Other residents.
5.9% Two Or More with 1,045 Two Or More residents.
14.0% Hispanic with 2,498 Hispanic residents.
| Race | Ashtabula | OH | USA |
|---|---|---|---|
| White | 70.1% | 75.8% | 57.4% |
| African American | 8.5% | 12.0% | 11.9% |
| American Indian | 0.0% | 0.1% | 0.5% |
| Asian | 0.5% | 2.5% | 5.9% |
| Hawaiian | 0.0% | 0.0% | 0.2% |
| Other | 1.0% | 0.4% | 0.6% |
| Two Or More | 5.9% | 4.3% | 4.3% |
| Hispanic | 14.0% | 4.8% | 19.3% |
Gender in Ashtabula
See the full breakdown
Ashtabula is 51.7% female with 9,234 female residents.
Ashtabula is 48.3% male with 8,622 male residents.
| Gender | Ashtabula | OH | USA |
|---|---|---|---|
| Female | 51.7% | 50.7% | 50.5% |
| Male | 48.3% | 49.3% | 49.5% |
Highest level of educational attainment in Ashtabula for adults over 25
See the full breakdown
7.0% of adults in Ashtabula completed < 9th grade.
10.0% of adults in Ashtabula completed 9-12th grade.
44.0% of adults in Ashtabula completed high school / ged.
20.0% of adults in Ashtabula completed some college.
8.0% of adults in Ashtabula completed associate's degree.
7.0% of adults in Ashtabula completed bachelor's degree.
4.0% of adults in Ashtabula completed master's degree.
0.0% of adults in Ashtabula completed professional degree.
0.0% of adults in Ashtabula completed doctorate degree.
| Education | Ashtabula | OH | USA |
|---|---|---|---|
| < 9th Grade | 7.0% | 3.0% | 4.0% |
| 9-12th Grade | 10.0% | 6.0% | 6.0% |
| High School / GED | 44.0% | 32.0% | 26.0% |
| Some College | 20.0% | 19.0% | 19.0% |
| Associate's Degree | 8.0% | 9.0% | 9.0% |
| Bachelor's Degree | 7.0% | 19.0% | 22.0% |
| Master's Degree | 4.0% | 9.0% | 10.0% |
| Professional Degree | 0.0% | 2.0% | 2.0% |
| Doctorate Degree | 0.0% | 1.0% | 2.0% |
Household Income For Ashtabula, Ohio
See the full breakdown
7.8% of households in Ashtabula earn Less than $10,000.
9.9% of households in Ashtabula earn $10,000 to $14,999.
11.2% of households in Ashtabula earn $15,000 to $24,999.
9.8% of households in Ashtabula earn $25,000 to $34,999.
18.7% of households in Ashtabula earn $35,000 to $49,999.
17.2% of households in Ashtabula earn $50,000 to $74,999.
10.5% of households in Ashtabula earn $75,000 to $99,999.
9.6% of households in Ashtabula earn $100,000 to $149,999.
2.5% of households in Ashtabula earn $150,000 to $199,999.
2.7% of households in Ashtabula earn $200,000 or more.
| Income | Ashtabula | OH | USA |
|---|---|---|---|
| Less than $10,000 | 7.8% | 5.2% | 5.0% |
| $10,000 to $14,999 | 9.9% | 4.0% | 3.4% |
| $15,000 to $24,999 | 11.2% | 7.1% | 6.3% |
| $25,000 to $34,999 | 9.8% | 7.5% | 6.6% |
| $35,000 to $49,999 | 18.7% | 11.6% | 10.1% |
| $50,000 to $74,999 | 17.2% | 16.9% | 15.5% |
| $75,000 to $99,999 | 10.5% | 13.1% | 12.6% |
| $100,000 to $149,999 | 9.6% | 17.1% | 17.5% |
| $150,000 to $199,999 | 2.5% | 8.3% | 9.6% |
| $200,000 or more | 2.7% | 9.1% | 13.4% |
Source: U.S. Census ACS 5-year estimates (2024)


