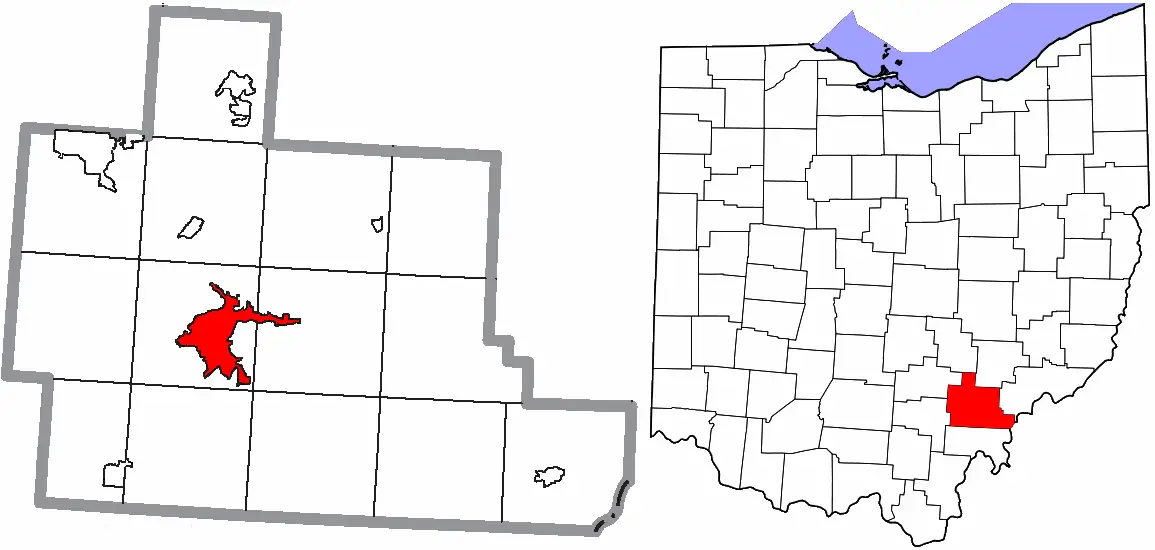
Athens, OH
Demographics And Statistics
Living In Athens, Ohio Summary
Life in Athens research summary. HomeSnacks has been using Saturday Night Science to research the quality of life in Athens over the past nine years using Census, FBI, Zillow, and other primary data sources. Based on the most recently available data, we found the following about life in Athens:
The population in Athens is 23,211.
The median home value in Athens is $240,070.
The median income in Athens is $37,059.
The cost of living in Athens is 96 which is 1.0x lower than the national average.
The median rent in Athens is $1,029.
The unemployment rate in Athens is 7.8%.
The poverty rate in Athens is 41.6%.
The average high in Athens is 63.8° and the average low is 40.6°.
Athens SnackAbility
Overall SnackAbility
Athens, OH Crime Report
Crime in Athens summary. We use data from the FBI to determine the crime rates in Athens. Key points include:
There were 266 total crimes in Athens in the last reporting year.
The overall crime rate per 100,000 people in Athens is 1,059.6 / 100k people.
The violent crime rate per 100,000 people in Athens is 95.6 / 100k people.
The property crime rate per 100,000 people in Athens is 964.0 / 100k people.
Overall, crime in Athens is -50.00% below the national average.
Total Crimes
Below National Average
Crime In Athens Comparison Table
| Statistic | Count Raw |
Athens / 100k People |
Ohio / 100k People |
National / 100k People |
|---|---|---|---|---|
| Total Crimes Per 100K | 266 | 1,059.6 | 1,844.9 | 2,119.2 |
| Violent Crime | 24 | 95.6 | 293.7 | 359.0 |
| Murder | 0 | 0.0 | 5.0 | 5.0 |
| Robbery | 4 | 15.9 | 45.5 | 61.0 |
| Aggravated Assault | 17 | 67.7 | 197.4 | 256.0 |
| Property Crime | 242 | 964.0 | 1,551.2 | 1,760.0 |
| Burglary | 22 | 87.6 | 206.0 | 229.0 |
| Larceny | 204 | 812.6 | 1,132.8 | 1,272.0 |
| Car Theft | 16 | 63.7 | 212.5 | 259.0 |
Athens, OH Cost Of Living
Cost of living in Athens summary. We use data on the cost of living to determine how expensive it is to live in Athens. Real estate prices drive most of the variance in cost of living around Ohio. Key points include:
The cost of living in Athens is 96 with 100 being average.
The cost of living in Athens is 1.0x lower than the national average.
The median home value in Athens is $240,070.
The median income in Athens is $37,059.
Athens's Overall Cost Of Living
Lower Than The National Average
Cost Of Living In Athens Comparison Table
| Living Expense | Athens | Ohio | National Average | |
|---|---|---|---|---|
| Overall | 96 | 93 | 100 | |
| Services | 95 | 101 | 100 | |
| Groceries | 103 | 103 | 100 | |
| Health | 86 | 97 | 100 | |
| Housing | 100 | 74 | 100 | |
| Transportation | 89 | 102 | 100 | |
| Utilities | 94 | 100 | 100 | |
Athens, OH Weather
The average high in Athens is 63.8° and the average low is 40.6°.
There are 80.0 days of precipitation each year.
Expect an average of 40.2 inches of precipitation each year with 17.1 inches of snow.
| Stat | Athens |
|---|---|
| Average Annual High | 63.8 |
| Average Annual Low | 40.6 |
| Annual Precipitation Days | 80.0 |
| Average Annual Precipitation | 40.2 |
| Average Annual Snowfall | 17.1 |
Average High
Days of Rain
Athens, OH Photos


1 Reviews & Comments About Athens
/5

HomeSnacks User - 2018-08-03 01:55:42.261138
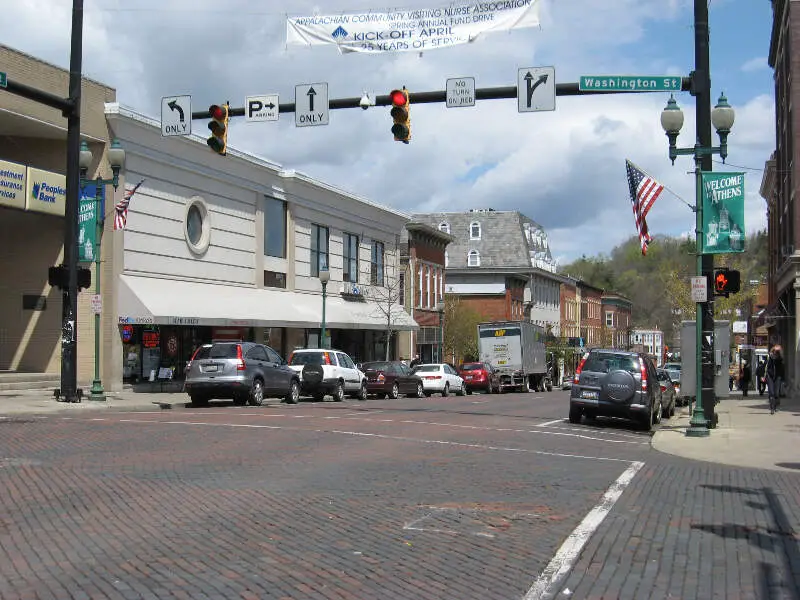
Athens is a pretty great place to live or visit. I originally fell in love with the town when I was touring colleges and soon followed that love to a degree at the local university. Though somewhat known for its impoverished status as one of the poorest cities in America, it is a lovely, arty city of a small size filled with things that make it unique and beautiful in and of itself. It may not have the best shopping or the most activities, but it has a certain charm that has kept me there even after graduating college.
Jackie O's Brewery is a well for its creative brews. Fluff Bakery has incredibly baked goods right within walking distance of campus. Ohio University is a beautiful college with a lot to see. The Dairy Barn has great arts and crafts to view on a daily basis. Avalanche Pizza is a local eatery that regularly wins competitions for the best pizza in the world.
Rankings for Athens in Ohio


Locations Around Athens
Map Of Athens, OH
Best Places Around Athens
Centerville, OH
Population 24,815
Centerville, OH
Population 24,815
Belpre, OH
Population 6,668
Marietta, OH
Population 13,282
Lancaster, OH
Population 40,902
Circleville, OH
Population 14,144
Logan, OH
Population 7,077
Murray, UT
Population 49,904
Athens Demographics And Statistics
Population over time in Athens
The current population in Athens is 23,211. The population has decreased -1.2% from 2010.
| Year | Population | % Change |
|---|---|---|
| 2023 | 23,211 | 2.3% |
| 2022 | 22,698 | -7.4% |
| 2021 | 24,507 | -1.9% |
| 2020 | 24,978 | -0.0% |
| 2019 | 24,984 | 0.9% |
| 2018 | 24,771 | 1.2% |
| 2017 | 24,486 | 0.5% |
| 2016 | 24,365 | 0.6% |
| 2015 | 24,220 | 0.3% |
| 2014 | 24,151 | -0.2% |
| 2013 | 24,201 | 0.8% |
| 2012 | 24,013 | 1.3% |
| 2011 | 23,711 | 1.0% |
| 2010 | 23,484 | - |
Race / Ethnicity in Athens
Athens is:
81.4% White with 18,890 White residents.
4.3% African American with 989 African American residents.
0.1% American Indian with 16 American Indian residents.
4.4% Asian with 1,030 Asian residents.
0.0% Hawaiian with 0 Hawaiian residents.
0.1% Other with 21 Other residents.
6.2% Two Or More with 1,440 Two Or More residents.
3.6% Hispanic with 825 Hispanic residents.
| Race | Athens | OH | USA |
|---|---|---|---|
| White | 81.4% | 76.5% | 58.2% |
| African American | 4.3% | 12.1% | 12.0% |
| American Indian | 0.1% | 0.1% | 0.5% |
| Asian | 4.4% | 2.4% | 5.7% |
| Hawaiian | 0.0% | 0.0% | 0.2% |
| Other | 0.1% | 0.4% | 0.5% |
| Two Or More | 6.2% | 3.9% | 3.9% |
| Hispanic | 3.6% | 4.6% | 19.0% |
Gender in Athens
Athens is 49.8% female with 11,552 female residents.
Athens is 50.2% male with 11,659 male residents.
| Gender | Athens | OH | USA |
|---|---|---|---|
| Female | 49.8% | 50.7% | 50.5% |
| Male | 50.2% | 49.3% | 49.5% |
Highest level of educational attainment in Athens for adults over 25
1.0% of adults in Athens completed < 9th grade.
4.0% of adults in Athens completed 9-12th grade.
11.0% of adults in Athens completed high school / ged.
11.0% of adults in Athens completed some college.
6.0% of adults in Athens completed associate's degree.
32.0% of adults in Athens completed bachelor's degree.
23.0% of adults in Athens completed master's degree.
2.0% of adults in Athens completed professional degree.
10.0% of adults in Athens completed doctorate degree.
| Education | Athens | OH | USA |
|---|---|---|---|
| < 9th Grade | 1.0% | 3.0% | 5.0% |
| 9-12th Grade | 4.0% | 6.0% | 6.0% |
| High School / GED | 11.0% | 32.0% | 26.0% |
| Some College | 11.0% | 19.0% | 19.0% |
| Associate's Degree | 6.0% | 9.0% | 9.0% |
| Bachelor's Degree | 32.0% | 19.0% | 21.0% |
| Master's Degree | 23.0% | 9.0% | 10.0% |
| Professional Degree | 2.0% | 2.0% | 2.0% |
| Doctorate Degree | 10.0% | 1.0% | 2.0% |
Household Income For Athens, Ohio
16.6% of households in Athens earn Less than $10,000.
10.1% of households in Athens earn $10,000 to $14,999.
15.0% of households in Athens earn $15,000 to $24,999.
6.5% of households in Athens earn $25,000 to $34,999.
11.6% of households in Athens earn $35,000 to $49,999.
9.1% of households in Athens earn $50,000 to $74,999.
8.5% of households in Athens earn $75,000 to $99,999.
10.2% of households in Athens earn $100,000 to $149,999.
6.0% of households in Athens earn $150,000 to $199,999.
6.6% of households in Athens earn $200,000 or more.
| Income | Athens | OH | USA |
|---|---|---|---|
| Less than $10,000 | 16.6% | 5.2% | 4.9% |
| $10,000 to $14,999 | 10.1% | 4.1% | 3.6% |
| $15,000 to $24,999 | 15.0% | 7.4% | 6.6% |
| $25,000 to $34,999 | 6.5% | 7.7% | 6.8% |
| $35,000 to $49,999 | 11.6% | 11.9% | 10.4% |
| $50,000 to $74,999 | 9.1% | 17.1% | 15.7% |
| $75,000 to $99,999 | 8.5% | 13.2% | 12.7% |
| $100,000 to $149,999 | 10.2% | 16.9% | 17.4% |
| $150,000 to $199,999 | 6.0% | 8.0% | 9.3% |
| $200,000 or more | 6.6% | 8.5% | 12.6% |


