Marietta SnackAbility
Overall SnackAbility
Crime in Marietta summary. We use data from the FBI to determine the crime rates in Marietta. Key points include:
There were 178 total crimes in Marietta in the last reporting year.
The overall crime rate per 100,000 people in Marietta is 1,359.7 / 100k people.
The violent crime rate per 100,000 people in Marietta is 76.4 / 100k people.
The property crime rate per 100,000 people in Marietta is 1,283.3 / 100k people.
Overall, crime in Marietta is -35.84% below the national average.
Total Crimes
Below National Average
Crime In Marietta Comparison Table
| Statistic | Count Raw |
Marietta / 100k People |
Ohio / 100k People |
National / 100k People |
|---|---|---|---|---|
| Total Crimes Per 100K | 178 | 1,359.7 | 1,844.9 | 2,119.2 |
| Violent Crime | 10 | 76.4 | 293.7 | 359.0 |
| Murder | 0 | 0.0 | 5.0 | 5.0 |
| Robbery | 1 | 7.6 | 45.5 | 61.0 |
| Aggravated Assault | 4 | 30.6 | 197.4 | 256.0 |
| Property Crime | 168 | 1,283.3 | 1,551.2 | 1,760.0 |
| Burglary | 10 | 76.4 | 206.0 | 229.0 |
| Larceny | 153 | 1,168.7 | 1,132.8 | 1,272.0 |
| Car Theft | 5 | 38.2 | 212.5 | 259.0 |
Source: FBI Uniform Crime Reporting (2024)
Cost of living in Marietta summary. We use data on the cost of living to determine how expensive it is to live in Marietta. Real estate prices drive most of the variance in cost of living around Ohio. Key points include:
The cost of living in Marietta is 88 with 100 being average.
The cost of living in Marietta is 0.9x lower than the national average.
The median home value in Marietta is $187,373.
The median income in Marietta is $47,873.
Marietta's Overall Cost Of Living
Lower Than The National Average
Cost Of Living In Marietta Comparison Table
| Living Expense | Marietta | Ohio | National Average |
|---|---|---|---|
| Overall | 88 | 90 | 100 |
| Services | 93 | 97 | 100 |
| Groceries | 95 | 97 | 100 |
| Health | 70 | 75 | 100 |
| Housing | 90 | 97 | 100 |
| Transportation | 95 | 95 | 100 |
| Utilities | 88 | 97 | 100 |
Source: Cost of living index, normalized to US average = 100
Marietta, OH Weather
The average high in Marietta is 64.6° and the average low is 42.2°.
There are 84.0 days of precipitation each year.
Expect an average of 42.8 inches of precipitation each year with 19.7 inches of snow.
| Stat | Marietta |
|---|---|
| Average Annual High | 64.6 |
| Average Annual Low | 42.2 |
| Annual Precipitation Days | 84.0 |
| Average Annual Precipitation | 42.8 |
| Average Annual Snowfall | 19.7 |
Average High
Days of Rain
Source: NOAA climate normals (30-year)
Marietta, OH Photos


1 Reviews & Comments About Marietta

I live in marietta and its not that bad here. I grew up in cincinnati and id rather raise my son in a small redneck town than a huge city. Much slower pace here.
Rankings & Articles For Marietta


Locations Around Marietta
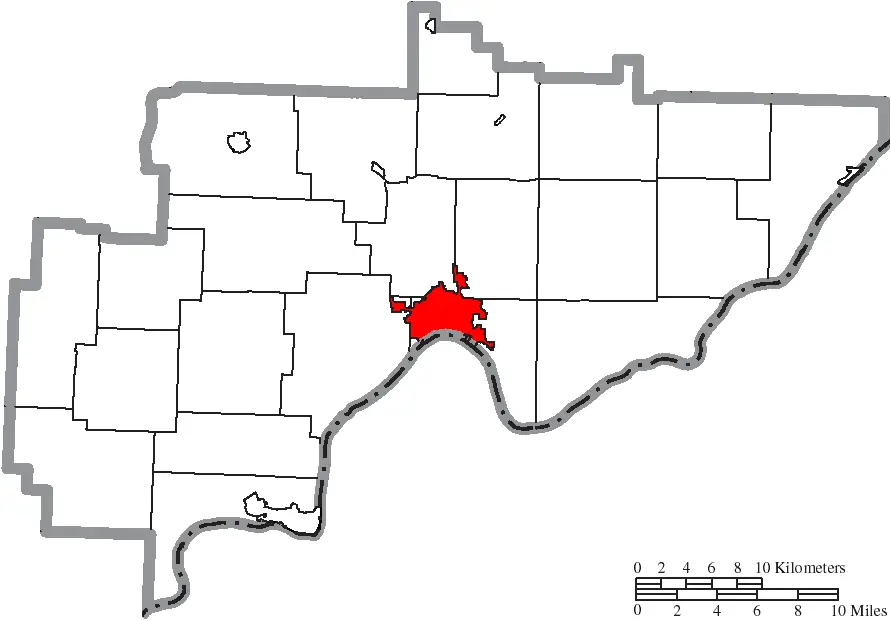
Map Of Marietta, OH
Best Places Around Marietta
Athens, OH
Population 23,396
Belpre, OH
Population 6,654
Morristown, TN
Population 31,527
Murray, UT
Population 50,188
Newport, OR
Population 10,583
Vienna, WV
Population 10,518
Cambridge, OH
Population 10,060
Parkersburg, WV
Population 29,240
Marietta Demographics And Statistics
Population over time in Marietta
The current population in Marietta is 13,203. The population has decreased 7.1% from 2010.
| Year | Population | % Change |
|---|---|---|
| 2024 | 13,203 | -0.6% |
| 2023 | 13,282 | -0.6% |
| 2022 | 13,366 | -1.4% |
| 2021 | 13,559 | 0.1% |
| 2020 | 13,551 | -0.3% |
| 2019 | 13,588 | -0.9% |
| 2018 | 13,718 | -0.6% |
| 2017 | 13,795 | -0.8% |
| 2016 | 13,912 | -0.6% |
| 2015 | 13,996 | -0.2% |
| 2014 | 14,029 | -0.3% |
| 2013 | 14,067 | -0.2% |
| 2012 | 14,102 | -0.4% |
| 2011 | 14,164 | -0.3% |
| 2010 | 14,211 | - |
Race / Ethnicity in Marietta
See the full breakdown
Marietta is:
92.8% White with 12,246 White residents.
1.2% African American with 153 African American residents.
0.0% American Indian with 1 American Indian residents.
0.8% Asian with 106 Asian residents.
0.0% Hawaiian with 0 Hawaiian residents.
0.4% Other with 55 Other residents.
3.4% Two Or More with 448 Two Or More residents.
1.5% Hispanic with 194 Hispanic residents.
| Race | Marietta | OH | USA |
|---|---|---|---|
| White | 92.8% | 75.8% | 57.4% |
| African American | 1.2% | 12.0% | 11.9% |
| American Indian | 0.0% | 0.1% | 0.5% |
| Asian | 0.8% | 2.5% | 5.9% |
| Hawaiian | 0.0% | 0.0% | 0.2% |
| Other | 0.4% | 0.4% | 0.6% |
| Two Or More | 3.4% | 4.3% | 4.3% |
| Hispanic | 1.5% | 4.8% | 19.3% |
Gender in Marietta
See the full breakdown
Marietta is 51.6% female with 6,814 female residents.
Marietta is 48.4% male with 6,388 male residents.
| Gender | Marietta | OH | USA |
|---|---|---|---|
| Female | 51.6% | 50.7% | 50.5% |
| Male | 48.4% | 49.3% | 49.5% |
Highest level of educational attainment in Marietta for adults over 25
See the full breakdown
2.0% of adults in Marietta completed < 9th grade.
7.0% of adults in Marietta completed 9-12th grade.
33.0% of adults in Marietta completed high school / ged.
19.0% of adults in Marietta completed some college.
11.0% of adults in Marietta completed associate's degree.
15.0% of adults in Marietta completed bachelor's degree.
8.0% of adults in Marietta completed master's degree.
3.0% of adults in Marietta completed professional degree.
2.0% of adults in Marietta completed doctorate degree.
| Education | Marietta | OH | USA |
|---|---|---|---|
| < 9th Grade | 2.0% | 3.0% | 4.0% |
| 9-12th Grade | 7.0% | 6.0% | 6.0% |
| High School / GED | 33.0% | 32.0% | 26.0% |
| Some College | 19.0% | 19.0% | 19.0% |
| Associate's Degree | 11.0% | 9.0% | 9.0% |
| Bachelor's Degree | 15.0% | 19.0% | 22.0% |
| Master's Degree | 8.0% | 9.0% | 10.0% |
| Professional Degree | 3.0% | 2.0% | 2.0% |
| Doctorate Degree | 2.0% | 1.0% | 2.0% |
Household Income For Marietta, Ohio
See the full breakdown
7.3% of households in Marietta earn Less than $10,000.
6.4% of households in Marietta earn $10,000 to $14,999.
14.5% of households in Marietta earn $15,000 to $24,999.
11.9% of households in Marietta earn $25,000 to $34,999.
11.4% of households in Marietta earn $35,000 to $49,999.
14.9% of households in Marietta earn $50,000 to $74,999.
12.1% of households in Marietta earn $75,000 to $99,999.
12.4% of households in Marietta earn $100,000 to $149,999.
4.6% of households in Marietta earn $150,000 to $199,999.
4.5% of households in Marietta earn $200,000 or more.
| Income | Marietta | OH | USA |
|---|---|---|---|
| Less than $10,000 | 7.3% | 5.2% | 5.0% |
| $10,000 to $14,999 | 6.4% | 4.0% | 3.4% |
| $15,000 to $24,999 | 14.5% | 7.1% | 6.3% |
| $25,000 to $34,999 | 11.9% | 7.5% | 6.6% |
| $35,000 to $49,999 | 11.4% | 11.6% | 10.1% |
| $50,000 to $74,999 | 14.9% | 16.9% | 15.5% |
| $75,000 to $99,999 | 12.1% | 13.1% | 12.6% |
| $100,000 to $149,999 | 12.4% | 17.1% | 17.5% |
| $150,000 to $199,999 | 4.6% | 8.3% | 9.6% |
| $200,000 or more | 4.5% | 9.1% | 13.4% |
Source: U.S. Census ACS 5-year estimates (2024)


