Compare Cleveland to…
Cleveland SnackAbility
Overall SnackAbility
Crime in Cleveland summary. We use data from the FBI to determine the crime rates in Cleveland. Key points include:
There were 21,720 total crimes in Cleveland in the last reporting year.
The overall crime rate per 100,000 people in Cleveland is 5,987.4 / 100k people.
The violent crime rate per 100,000 people in Cleveland is 1,561.1 / 100k people.
The property crime rate per 100,000 people in Cleveland is 4,426.3 / 100k people.
Overall, crime in Cleveland is 182.53% above the national average.
Total Crimes
Above National Average
Crime In Cleveland Comparison Table
| Statistic | Count Raw |
Cleveland / 100k People |
Ohio / 100k People |
National / 100k People |
|---|---|---|---|---|
| Total Crimes Per 100K | 21,720 | 5,987.4 | 1,844.9 | 2,119.2 |
| Violent Crime | 5,663 | 1,561.1 | 293.7 | 359.0 |
| Murder | 109 | 30.0 | 5.0 | 5.0 |
| Robbery | 1,412 | 389.2 | 45.5 | 61.0 |
| Aggravated Assault | 3,631 | 1,000.9 | 197.4 | 256.0 |
| Property Crime | 16,057 | 4,426.3 | 1,551.2 | 1,760.0 |
| Burglary | 3,121 | 860.3 | 206.0 | 229.0 |
| Larceny | 8,777 | 2,419.5 | 1,132.8 | 1,272.0 |
| Car Theft | 4,159 | 1,146.5 | 212.5 | 259.0 |
Source: FBI Uniform Crime Reporting (2024)
Cost of living in Cleveland summary. We use data on the cost of living to determine how expensive it is to live in Cleveland. Real estate prices drive most of the variance in cost of living around Ohio. Key points include:
The cost of living in Cleveland is 80 with 100 being average.
The cost of living in Cleveland is 0.8x lower than the national average.
The median home value in Cleveland is $115,536.
The median income in Cleveland is $40,801.
Cleveland's Overall Cost Of Living
Lower Than The National Average
Cost Of Living In Cleveland Comparison Table
| Living Expense | Cleveland | Ohio | National Average |
|---|---|---|---|
| Overall | 80 | 90 | 100 |
| Services | 96 | 97 | 100 |
| Groceries | 91 | 97 | 100 |
| Health | 48 | 75 | 100 |
| Housing | 91 | 97 | 100 |
| Transportation | 98 | 95 | 100 |
| Utilities | 97 | 97 | 100 |
Source: Cost of living index, normalized to US average = 100
Cleveland, OH Weather
The average high in Cleveland is 59.3° and the average low is 43.1°.
There are 89.7 days of precipitation each year.
Expect an average of 39.6 inches of precipitation each year with 60.0 inches of snow.
| Stat | Cleveland |
|---|---|
| Average Annual High | 59.3 |
| Average Annual Low | 43.1 |
| Annual Precipitation Days | 89.7 |
| Average Annual Precipitation | 39.6 |
| Average Annual Snowfall | 60.0 |
Average High
Days of Rain
Source: NOAA climate normals (30-year)
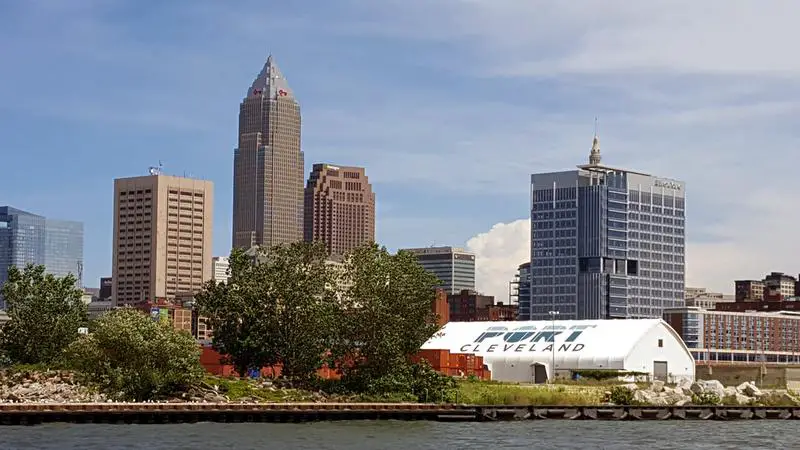
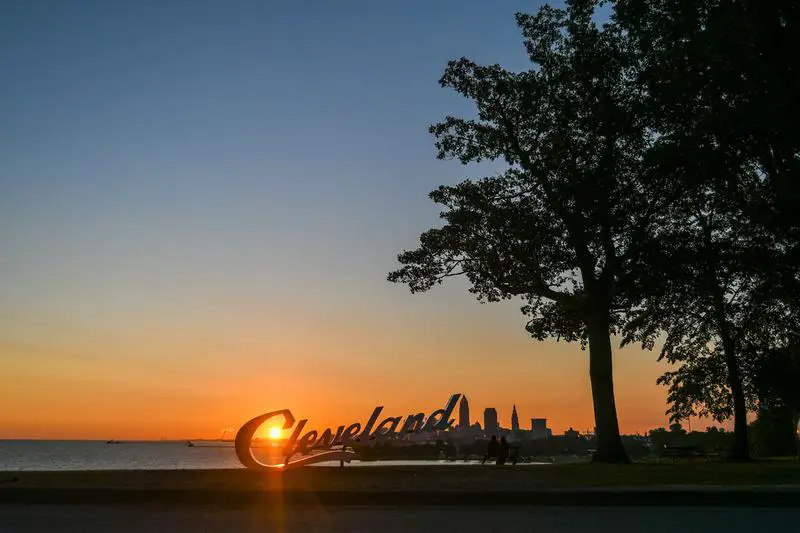
Cleveland, OH Photos


11 Reviews & Comments About Cleveland

I live in cleveland, have my whole life and I must say I love my city.. and I live on 33rd and denison.. so Im in the heart of it all
Cleveland is NOT THAT BAD. I live in Cleveland and people are not that mean. Most people always say hi and people are always walking around on the sidewalks happy.
Ridiculous. Cleveland is a great city. I was born and raised there.
I live in Cleveland. There are a lot of evil people here.
Just a reminder to y'all that Jake Paul was born in Cleveland.
I stayed in Cleveland, Ohio for about 2 months because I was currently staying with a friend at his house and during that time I would have to say it was the worst of my life. The crime rate is high and horrible and everyday I would hear gunshots in the neighborhood and people fighting one another. Also, the homes are run down and it is just a city that is dominated by violence and poverty. I will always stay away from this place.
To be honest, my whole time spent there was horrible from the violence to seeing nothing but run down homes. It was just a bad experience overall and I see why no one travels there.
I grew up here. It is completely segreated in terms of living. Some areas are really nice and classy while others are barren and proverty filled. Everything seems to have an invisible barrier when it comes to socialization, by that I mean some classes only associate themselves with their own and not too much outside. The weather is primarily cold, so there is not enough sunny days. I think the poor air quality and proverty effects the people too, the poorer physically look un healthier than those who are careful and can afford better care, but I think it depends on ones thinking.
The museums like the Rock and roll hall of fame, Art museum, and Children's Museum.
Everything in Cleveland is terrible. The crime, the roads, the people, the weather. It is the worst place I have ever had the misfortune to live in.
The worst thing is the snow in the winter months and having to deal with all of cold and mess. Everybody is really cranky so you get no friendliness from people. The air quality s***s so you can never take a real breath. Just an awful place.
I have lived in Cleveland, OH for five years now and I enjoy the many attractions there are including sporting events, downtown, variety of food places, and the night scene.
Downtown Cleveland, University Circle, and Little Italy are my top 3 favorite places in Cleveland. The things I do not like about Cleveland are the brutal winters due to the lake effect and crime rate in certain areas.
Cleveland has all the benefits of a big city without the heavy traffic and high prices. There are great sports, art museums, plays, and restaurants.
The east 4th street area and the Flats stand out with great places to eat, drink, and hang out.
I love the city i live in because of the people and the schools system are good for my children.
My city have the rock&roll hall of fame and tower city. Also we have lake erie where i go fishing.
Rankings & Articles For Cleveland


Locations Around Cleveland
Map Of Cleveland, OH
Best Places Around Cleveland
Shaker Heights, OH
Population 28,922
Westlake, OH
Population 34,104
Highland Heights, OH
Population 8,623
Macedonia, OH
Population 12,152
Pepper Pike, OH
Population 6,840
Solon, OH
Population 23,943
North Olmsted, OH
Population 31,924
Broadview Heights, OH
Population 19,771
Strongsville, OH
Population 45,983
Rocky River, OH
Population 21,490
Cleveland Demographics And Statistics
Population over time in Cleveland
The current population in Cleveland is 366,097. The population has decreased 10.5% from 2010.
| Year | Population | % Change |
|---|---|---|
| 2024 | 366,097 | -0.4% |
| 2023 | 367,523 | -0.8% |
| 2022 | 370,365 | -1.2% |
| 2021 | 374,861 | -2.2% |
| 2020 | 383,331 | -0.5% |
| 2019 | 385,282 | -0.5% |
| 2018 | 387,398 | -0.4% |
| 2017 | 388,812 | -0.1% |
| 2016 | 389,165 | -0.4% |
| 2015 | 390,584 | -0.4% |
| 2014 | 392,114 | -0.6% |
| 2013 | 394,335 | -0.9% |
| 2012 | 397,972 | -1.3% |
| 2011 | 403,163 | -1.5% |
| 2010 | 409,221 | - |
Race / Ethnicity in Cleveland
See the full breakdown
Cleveland is:
33.7% White with 123,383 White residents.
45.1% African American with 165,163 African American residents.
0.1% American Indian with 268 American Indian residents.
2.6% Asian with 9,547 Asian residents.
0.0% Hawaiian with 71 Hawaiian residents.
0.6% Other with 2,308 Other residents.
4.6% Two Or More with 16,861 Two Or More residents.
13.2% Hispanic with 48,496 Hispanic residents.
| Race | Cleveland | OH | USA |
|---|---|---|---|
| White | 33.7% | 75.8% | 57.4% |
| African American | 45.1% | 12.0% | 11.9% |
| American Indian | 0.1% | 0.1% | 0.5% |
| Asian | 2.6% | 2.5% | 5.9% |
| Hawaiian | 0.0% | 0.0% | 0.2% |
| Other | 0.6% | 0.4% | 0.6% |
| Two Or More | 4.6% | 4.3% | 4.3% |
| Hispanic | 13.2% | 4.8% | 19.3% |
Gender in Cleveland
See the full breakdown
Cleveland is 51.5% female with 188,520 female residents.
Cleveland is 48.5% male with 177,576 male residents.
| Gender | Cleveland | OH | USA |
|---|---|---|---|
| Female | 51.5% | 50.7% | 50.5% |
| Male | 48.5% | 49.3% | 49.5% |
Highest level of educational attainment in Cleveland for adults over 25
See the full breakdown
5.0% of adults in Cleveland completed < 9th grade.
11.0% of adults in Cleveland completed 9-12th grade.
34.0% of adults in Cleveland completed high school / ged.
21.0% of adults in Cleveland completed some college.
7.0% of adults in Cleveland completed associate's degree.
13.0% of adults in Cleveland completed bachelor's degree.
6.0% of adults in Cleveland completed master's degree.
2.0% of adults in Cleveland completed professional degree.
1.0% of adults in Cleveland completed doctorate degree.
| Education | Cleveland | OH | USA |
|---|---|---|---|
| < 9th Grade | 5.0% | 3.0% | 4.0% |
| 9-12th Grade | 11.0% | 6.0% | 6.0% |
| High School / GED | 34.0% | 32.0% | 26.0% |
| Some College | 21.0% | 19.0% | 19.0% |
| Associate's Degree | 7.0% | 9.0% | 9.0% |
| Bachelor's Degree | 13.0% | 19.0% | 22.0% |
| Master's Degree | 6.0% | 9.0% | 10.0% |
| Professional Degree | 2.0% | 2.0% | 2.0% |
| Doctorate Degree | 1.0% | 1.0% | 2.0% |
Household Income For Cleveland, Ohio
See the full breakdown
12.9% of households in Cleveland earn Less than $10,000.
9.0% of households in Cleveland earn $10,000 to $14,999.
11.9% of households in Cleveland earn $15,000 to $24,999.
10.6% of households in Cleveland earn $25,000 to $34,999.
13.7% of households in Cleveland earn $35,000 to $49,999.
16.3% of households in Cleveland earn $50,000 to $74,999.
9.5% of households in Cleveland earn $75,000 to $99,999.
9.1% of households in Cleveland earn $100,000 to $149,999.
3.8% of households in Cleveland earn $150,000 to $199,999.
3.3% of households in Cleveland earn $200,000 or more.
| Income | Cleveland | OH | USA |
|---|---|---|---|
| Less than $10,000 | 12.9% | 5.2% | 5.0% |
| $10,000 to $14,999 | 9.0% | 4.0% | 3.4% |
| $15,000 to $24,999 | 11.9% | 7.1% | 6.3% |
| $25,000 to $34,999 | 10.6% | 7.5% | 6.6% |
| $35,000 to $49,999 | 13.7% | 11.6% | 10.1% |
| $50,000 to $74,999 | 16.3% | 16.9% | 15.5% |
| $75,000 to $99,999 | 9.5% | 13.1% | 12.6% |
| $100,000 to $149,999 | 9.1% | 17.1% | 17.5% |
| $150,000 to $199,999 | 3.8% | 8.3% | 9.6% |
| $200,000 or more | 3.3% | 9.1% | 13.4% |
Source: U.S. Census ACS 5-year estimates (2024)


