East Cleveland SnackAbility
Overall SnackAbility
Crime in East Cleveland summary. We use data from the FBI to determine the crime rates in East Cleveland. Key points include:
There were 588 total crimes in East Cleveland in the last reporting year.
The overall crime rate per 100,000 people in East Cleveland is 4,409.1 / 100k people.
The violent crime rate per 100,000 people in East Cleveland is 1,409.7 / 100k people.
The property crime rate per 100,000 people in East Cleveland is 2,999.4 / 100k people.
Overall, crime in East Cleveland is 108.05% above the national average.
Total Crimes
Above National Average
Crime In East Cleveland Comparison Table
| Statistic | Count Raw |
East Cleveland / 100k People |
Ohio / 100k People |
National / 100k People |
|---|---|---|---|---|
| Total Crimes Per 100K | 588 | 4,409.1 | 1,844.9 | 2,119.2 |
| Violent Crime | 188 | 1,409.7 | 293.7 | 359.0 |
| Murder | 5 | 37.5 | 5.0 | 5.0 |
| Robbery | 33 | 247.5 | 45.5 | 61.0 |
| Aggravated Assault | 138 | 1,034.8 | 197.4 | 256.0 |
| Property Crime | 400 | 2,999.4 | 1,551.2 | 1,760.0 |
| Burglary | 74 | 554.9 | 206.0 | 229.0 |
| Larceny | 200 | 1,499.7 | 1,132.8 | 1,272.0 |
| Car Theft | 126 | 944.8 | 212.5 | 259.0 |
Source: FBI Uniform Crime Reporting (2024)
Cost of living in East Cleveland summary. We use data on the cost of living to determine how expensive it is to live in East Cleveland. Real estate prices drive most of the variance in cost of living around Ohio. Key points include:
The cost of living in East Cleveland is 81 with 100 being average.
The cost of living in East Cleveland is 0.8x lower than the national average.
The median home value in East Cleveland is $75,766.
The median income in East Cleveland is $22,116.
East Cleveland's Overall Cost Of Living
Lower Than The National Average
Cost Of Living In East Cleveland Comparison Table
| Living Expense | East Cleveland | Ohio | National Average |
|---|---|---|---|
| Overall | 81 | 90 | 100 |
| Services | 97 | 97 | 100 |
| Groceries | 99 | 97 | 100 |
| Health | 42 | 75 | 100 |
| Housing | 93 | 97 | 100 |
| Transportation | 94 | 95 | 100 |
| Utilities | 94 | 97 | 100 |
Source: Cost of living index, normalized to US average = 100
East Cleveland, OH Weather
The average high in East Cleveland is 59.3° and the average low is 42.9°.
There are 98.6 days of precipitation each year.
Expect an average of 41.0 inches of precipitation each year with 69.7 inches of snow.
| Stat | East Cleveland |
|---|---|
| Average Annual High | 59.3 |
| Average Annual Low | 42.9 |
| Annual Precipitation Days | 98.6 |
| Average Annual Precipitation | 41.0 |
| Average Annual Snowfall | 69.7 |
Average High
Days of Rain
Source: NOAA climate normals (30-year)
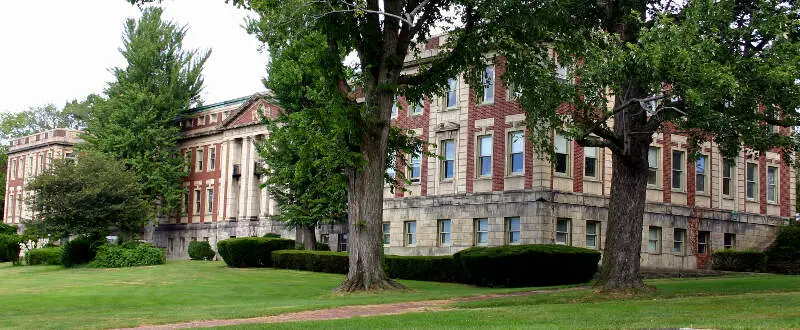
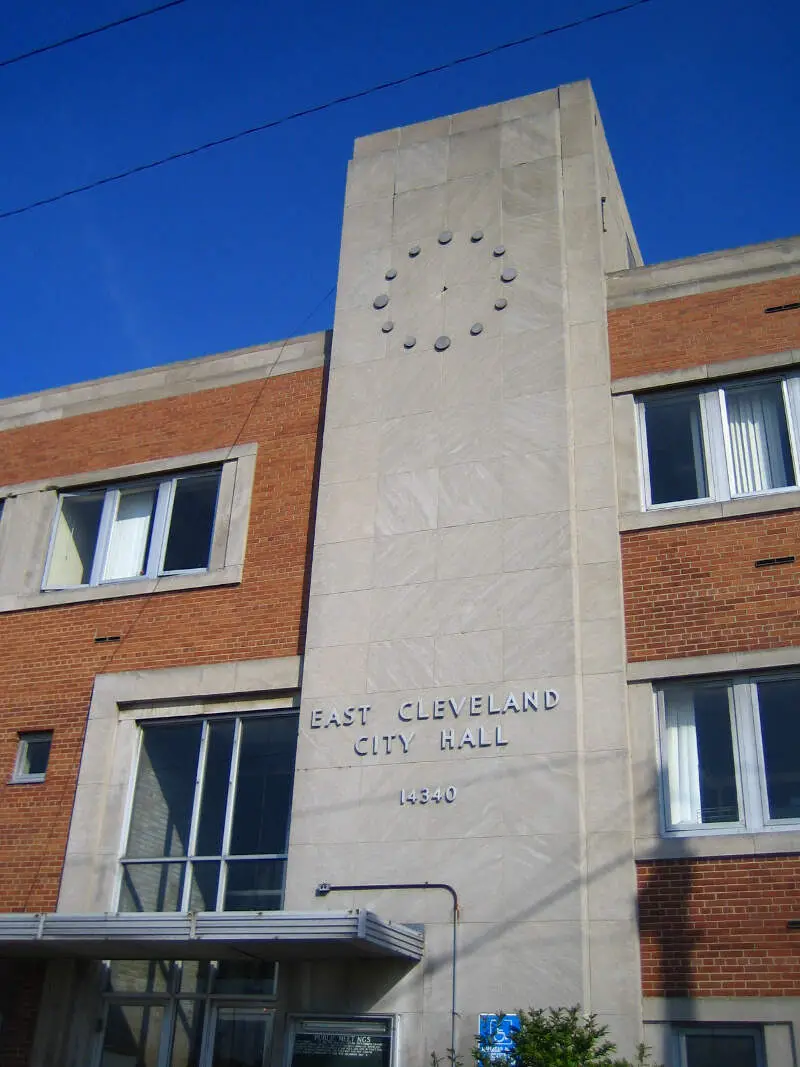
East Cleveland, OH Photos
3 Reviews & Comments About East Cleveland

I live in Strongsville Ohio, but I gotta drive to East Cleveland around E.140th everyday to get my dope. I've been going out that way for years unfortunately, and it's bad over there. Luckily though I've never had a single problem.
I live in East Cleveland but not in the hood I live in a suburb city in eat clevland,
I live in east cleveland and well,,it does kinda s**k haha. Also it's true people are still worshipping the Cavs.
Rankings & Articles For East Cleveland


Locations Around East Cleveland
Map Of East Cleveland, OH
Best Places Around East Cleveland
Shaker Heights, OH
Population 28,922
Westlake, OH
Population 34,104
Highland Heights, OH
Population 8,623
Macedonia, OH
Population 12,152
Pepper Pike, OH
Population 6,840
Solon, OH
Population 23,943
North Olmsted, OH
Population 31,924
Broadview Heights, OH
Population 19,771
Strongsville, OH
Population 45,983
Rocky River, OH
Population 21,490
East Cleveland Demographics And Statistics
Population over time in East Cleveland
The current population in East Cleveland is 13,534. The population has decreased 30.3% from 2010.
| Year | Population | % Change |
|---|---|---|
| 2024 | 13,534 | -1.0% |
| 2023 | 13,666 | -1.9% |
| 2022 | 13,926 | -2.0% |
| 2021 | 14,212 | -16.6% |
| 2020 | 17,047 | -0.9% |
| 2019 | 17,200 | -0.7% |
| 2018 | 17,321 | -0.3% |
| 2017 | 17,375 | -0.2% |
| 2016 | 17,413 | -0.6% |
| 2015 | 17,519 | -0.6% |
| 2014 | 17,619 | -1.1% |
| 2013 | 17,812 | -2.0% |
| 2012 | 18,179 | -2.9% |
| 2011 | 18,722 | -3.6% |
| 2010 | 19,426 | - |
Race / Ethnicity in East Cleveland
See the full breakdown
East Cleveland is:
8.1% White with 1,094 White residents.
87.3% African American with 11,809 African American residents.
0.1% American Indian with 11 American Indian residents.
0.9% Asian with 128 Asian residents.
0.0% Hawaiian with 0 Hawaiian residents.
0.7% Other with 96 Other residents.
1.7% Two Or More with 227 Two Or More residents.
1.2% Hispanic with 169 Hispanic residents.
| Race | East Cleveland | OH | USA |
|---|---|---|---|
| White | 8.1% | 75.8% | 57.4% |
| African American | 87.3% | 12.0% | 11.9% |
| American Indian | 0.1% | 0.1% | 0.5% |
| Asian | 0.9% | 2.5% | 5.9% |
| Hawaiian | 0.0% | 0.0% | 0.2% |
| Other | 0.7% | 0.4% | 0.6% |
| Two Or More | 1.7% | 4.3% | 4.3% |
| Hispanic | 1.2% | 4.8% | 19.3% |
Gender in East Cleveland
See the full breakdown
East Cleveland is 58.6% female with 7,929 female residents.
East Cleveland is 41.4% male with 5,605 male residents.
| Gender | East Cleveland | OH | USA |
|---|---|---|---|
| Female | 58.6% | 50.7% | 50.5% |
| Male | 41.4% | 49.3% | 49.5% |
Highest level of educational attainment in East Cleveland for adults over 25
See the full breakdown
5.0% of adults in East Cleveland completed < 9th grade.
12.0% of adults in East Cleveland completed 9-12th grade.
30.0% of adults in East Cleveland completed high school / ged.
26.0% of adults in East Cleveland completed some college.
10.0% of adults in East Cleveland completed associate's degree.
11.0% of adults in East Cleveland completed bachelor's degree.
6.0% of adults in East Cleveland completed master's degree.
0.0% of adults in East Cleveland completed professional degree.
0.0% of adults in East Cleveland completed doctorate degree.
| Education | East Cleveland | OH | USA |
|---|---|---|---|
| < 9th Grade | 5.0% | 3.0% | 4.0% |
| 9-12th Grade | 12.0% | 6.0% | 6.0% |
| High School / GED | 30.0% | 32.0% | 26.0% |
| Some College | 26.0% | 19.0% | 19.0% |
| Associate's Degree | 10.0% | 9.0% | 9.0% |
| Bachelor's Degree | 11.0% | 19.0% | 22.0% |
| Master's Degree | 6.0% | 9.0% | 10.0% |
| Professional Degree | 0.0% | 2.0% | 2.0% |
| Doctorate Degree | 0.0% | 1.0% | 2.0% |
Household Income For East Cleveland, Ohio
See the full breakdown
18.6% of households in East Cleveland earn Less than $10,000.
20.2% of households in East Cleveland earn $10,000 to $14,999.
15.9% of households in East Cleveland earn $15,000 to $24,999.
10.9% of households in East Cleveland earn $25,000 to $34,999.
9.1% of households in East Cleveland earn $35,000 to $49,999.
10.3% of households in East Cleveland earn $50,000 to $74,999.
3.8% of households in East Cleveland earn $75,000 to $99,999.
4.5% of households in East Cleveland earn $100,000 to $149,999.
2.3% of households in East Cleveland earn $150,000 to $199,999.
4.2% of households in East Cleveland earn $200,000 or more.
| Income | East Cleveland | OH | USA |
|---|---|---|---|
| Less than $10,000 | 18.6% | 5.2% | 5.0% |
| $10,000 to $14,999 | 20.2% | 4.0% | 3.4% |
| $15,000 to $24,999 | 15.9% | 7.1% | 6.3% |
| $25,000 to $34,999 | 10.9% | 7.5% | 6.6% |
| $35,000 to $49,999 | 9.1% | 11.6% | 10.1% |
| $50,000 to $74,999 | 10.3% | 16.9% | 15.5% |
| $75,000 to $99,999 | 3.8% | 13.1% | 12.6% |
| $100,000 to $149,999 | 4.5% | 17.1% | 17.5% |
| $150,000 to $199,999 | 2.3% | 8.3% | 9.6% |
| $200,000 or more | 4.2% | 9.1% | 13.4% |
Source: U.S. Census ACS 5-year estimates (2024)


