Findlay, OH
Demographics And Statistics
Living In Findlay, Ohio Summary
Life in Findlay research summary. HomeSnacks has been using Saturday Night Science to research the quality of life in Findlay over the past nine years using Census, FBI, Zillow, and other primary data sources. Based on the most recently available data, we found the following about life in Findlay:
The population in Findlay is 40,280.
The median home value in Findlay is $237,572.
The median income in Findlay is $57,344.
The cost of living in Findlay is 92 which is 0.9x lower than the national average.
The median rent in Findlay is $917.
The unemployment rate in Findlay is 3.6%.
The poverty rate in Findlay is 13.6%.
The average high in Findlay is 59.8° and the average low is 41.1°.
Findlay SnackAbility
Overall SnackAbility
Findlay, OH Crime Report
Crime in Findlay summary. We use data from the FBI to determine the crime rates in Findlay. Key points include:
There were 781 total crimes in Findlay in the last reporting year.
The overall crime rate per 100,000 people in Findlay is 1,948.2 / 100k people.
The violent crime rate per 100,000 people in Findlay is 314.3 / 100k people.
The property crime rate per 100,000 people in Findlay is 1,633.9 / 100k people.
Overall, crime in Findlay is -8.07% below the national average.
Total Crimes
Below National Average
Crime In Findlay Comparison Table
| Statistic | Count Raw |
Findlay / 100k People |
Ohio / 100k People |
National / 100k People |
|---|---|---|---|---|
| Total Crimes Per 100K | 781 | 1,948.2 | 1,844.9 | 2,119.2 |
| Violent Crime | 126 | 314.3 | 293.7 | 359.0 |
| Murder | 2 | 5.0 | 5.0 | 5.0 |
| Robbery | 11 | 27.4 | 45.5 | 61.0 |
| Aggravated Assault | 76 | 189.6 | 197.4 | 256.0 |
| Property Crime | 655 | 1,633.9 | 1,551.2 | 1,760.0 |
| Burglary | 58 | 144.7 | 206.0 | 229.0 |
| Larceny | 581 | 1,449.3 | 1,132.8 | 1,272.0 |
| Car Theft | 16 | 39.9 | 212.5 | 259.0 |
Findlay, OH Cost Of Living
Cost of living in Findlay summary. We use data on the cost of living to determine how expensive it is to live in Findlay. Real estate prices drive most of the variance in cost of living around Ohio. Key points include:
The cost of living in Findlay is 92 with 100 being average.
The cost of living in Findlay is 0.9x lower than the national average.
The median home value in Findlay is $237,572.
The median income in Findlay is $57,344.
Findlay's Overall Cost Of Living
Lower Than The National Average
Cost Of Living In Findlay Comparison Table
| Living Expense | Findlay | Ohio | National Average | |
|---|---|---|---|---|
| Overall | 92 | 93 | 100 | |
| Services | 105 | 101 | 100 | |
| Groceries | 98 | 103 | 100 | |
| Health | 86 | 97 | 100 | |
| Housing | 75 | 74 | 100 | |
| Transportation | 102 | 102 | 100 | |
| Utilities | 95 | 100 | 100 | |
Findlay, OH Weather
The average high in Findlay is 59.8° and the average low is 41.1°.
There are 76.9 days of precipitation each year.
Expect an average of 35.7 inches of precipitation each year with 23.6 inches of snow.
| Stat | Findlay |
|---|---|
| Average Annual High | 59.8 |
| Average Annual Low | 41.1 |
| Annual Precipitation Days | 76.9 |
| Average Annual Precipitation | 35.7 |
| Average Annual Snowfall | 23.6 |
Average High
Days of Rain
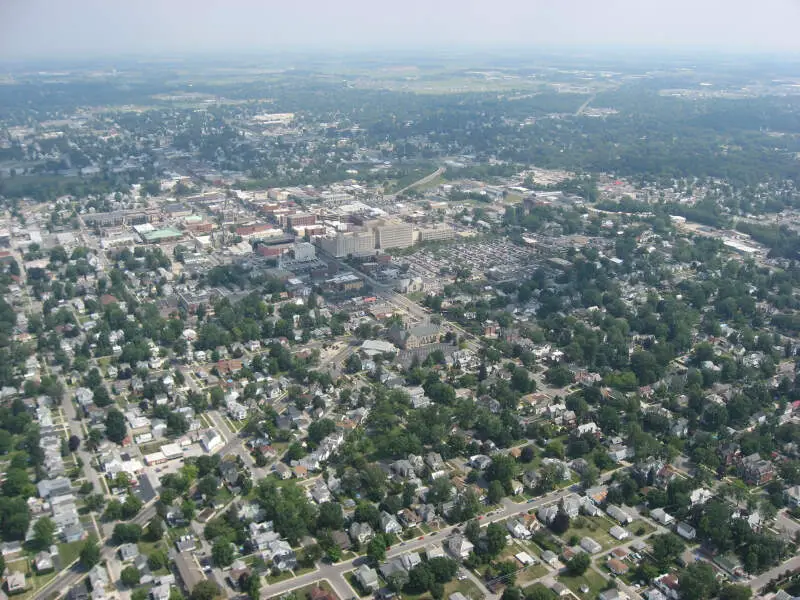
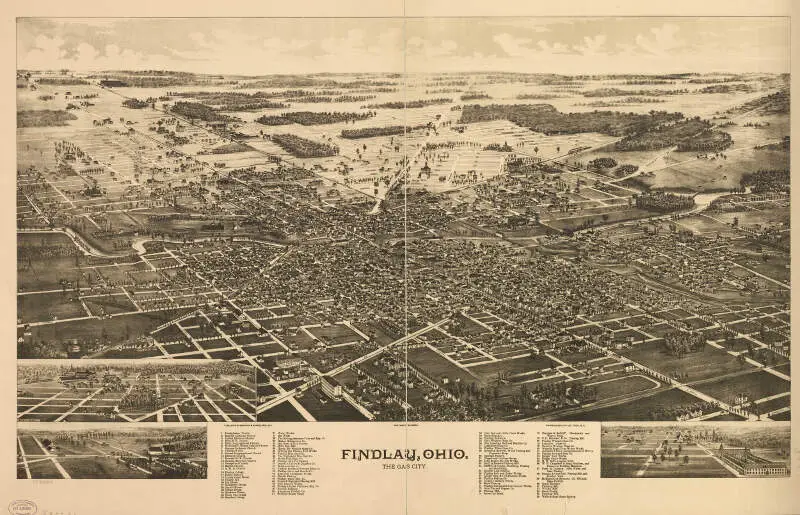
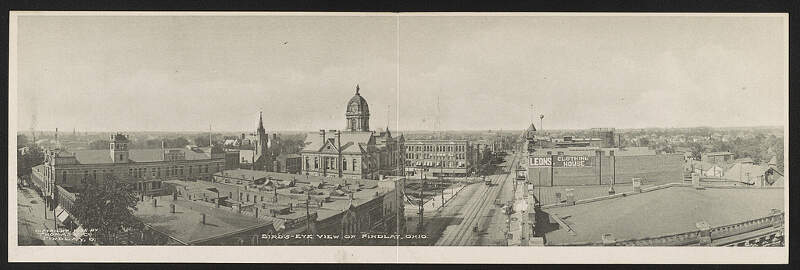
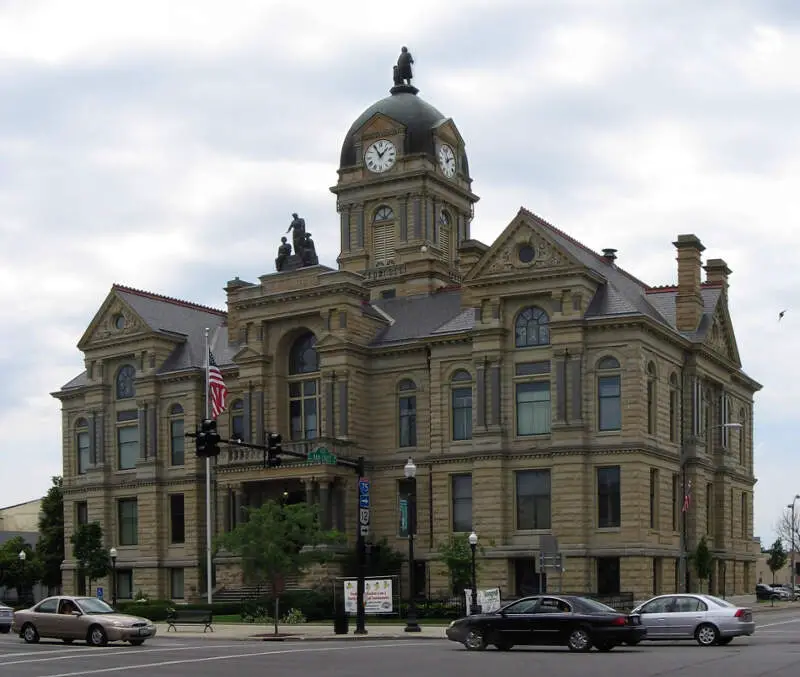
Findlay, OH Photos


Rankings for Findlay in Ohio


Locations Around Findlay
Map Of Findlay, OH
Best Places Around Findlay
Oakwood, OH
Population 9,480
Perrysburg, OH
Population 25,065
Sylvania, OH
Population 19,038
Waterville, OH
Population 5,997
Wapakoneta, OH
Population 9,867
Rossford, OH
Population 6,315
Ada, OH
Population 4,553
Bowling Green, OH
Population 30,051
Port Clinton, OH
Population 5,999
Maumee, OH
Population 13,765
Findlay Demographics And Statistics
Population over time in Findlay
The current population in Findlay is 40,280. The population has decreased -2.2% from 2010.
| Year | Population | % Change |
|---|---|---|
| 2023 | 40,280 | -0.3% |
| 2022 | 40,408 | 0.2% |
| 2021 | 40,323 | -1.9% |
| 2020 | 41,098 | -0.6% |
| 2019 | 41,335 | 0.1% |
| 2018 | 41,276 | 0.1% |
| 2017 | 41,237 | -0.4% |
| 2016 | 41,412 | 0.3% |
| 2015 | 41,278 | -0.0% |
| 2014 | 41,297 | -0.2% |
| 2013 | 41,373 | 0.2% |
| 2012 | 41,301 | 0.1% |
| 2011 | 41,264 | 0.2% |
| 2010 | 41,189 | - |
Race / Ethnicity in Findlay
Findlay is:
83.9% White with 33,790 White residents.
2.6% African American with 1,039 African American residents.
0.1% American Indian with 50 American Indian residents.
2.4% Asian with 947 Asian residents.
0.0% Hawaiian with 15 Hawaiian residents.
0.3% Other with 129 Other residents.
2.8% Two Or More with 1,135 Two Or More residents.
7.9% Hispanic with 3,175 Hispanic residents.
| Race | Findlay | OH | USA |
|---|---|---|---|
| White | 83.9% | 76.5% | 58.2% |
| African American | 2.6% | 12.1% | 12.0% |
| American Indian | 0.1% | 0.1% | 0.5% |
| Asian | 2.4% | 2.4% | 5.7% |
| Hawaiian | 0.0% | 0.0% | 0.2% |
| Other | 0.3% | 0.4% | 0.5% |
| Two Or More | 2.8% | 3.9% | 3.9% |
| Hispanic | 7.9% | 4.6% | 19.0% |
Gender in Findlay
Findlay is 52.1% female with 20,979 female residents.
Findlay is 47.9% male with 19,301 male residents.
| Gender | Findlay | OH | USA |
|---|---|---|---|
| Female | 52.1% | 50.7% | 50.5% |
| Male | 47.9% | 49.3% | 49.5% |
Highest level of educational attainment in Findlay for adults over 25
1.0% of adults in Findlay completed < 9th grade.
5.0% of adults in Findlay completed 9-12th grade.
35.0% of adults in Findlay completed high school / ged.
21.0% of adults in Findlay completed some college.
9.0% of adults in Findlay completed associate's degree.
19.0% of adults in Findlay completed bachelor's degree.
8.0% of adults in Findlay completed master's degree.
1.0% of adults in Findlay completed professional degree.
1.0% of adults in Findlay completed doctorate degree.
| Education | Findlay | OH | USA |
|---|---|---|---|
| < 9th Grade | 1.0% | 3.0% | 5.0% |
| 9-12th Grade | 5.0% | 6.0% | 6.0% |
| High School / GED | 35.0% | 32.0% | 26.0% |
| Some College | 21.0% | 19.0% | 19.0% |
| Associate's Degree | 9.0% | 9.0% | 9.0% |
| Bachelor's Degree | 19.0% | 19.0% | 21.0% |
| Master's Degree | 8.0% | 9.0% | 10.0% |
| Professional Degree | 1.0% | 2.0% | 2.0% |
| Doctorate Degree | 1.0% | 1.0% | 2.0% |
Household Income For Findlay, Ohio
4.0% of households in Findlay earn Less than $10,000.
5.7% of households in Findlay earn $10,000 to $14,999.
7.1% of households in Findlay earn $15,000 to $24,999.
11.8% of households in Findlay earn $25,000 to $34,999.
14.7% of households in Findlay earn $35,000 to $49,999.
18.8% of households in Findlay earn $50,000 to $74,999.
12.6% of households in Findlay earn $75,000 to $99,999.
12.6% of households in Findlay earn $100,000 to $149,999.
6.3% of households in Findlay earn $150,000 to $199,999.
6.2% of households in Findlay earn $200,000 or more.
| Income | Findlay | OH | USA |
|---|---|---|---|
| Less than $10,000 | 4.0% | 5.2% | 4.9% |
| $10,000 to $14,999 | 5.7% | 4.1% | 3.6% |
| $15,000 to $24,999 | 7.1% | 7.4% | 6.6% |
| $25,000 to $34,999 | 11.8% | 7.7% | 6.8% |
| $35,000 to $49,999 | 14.7% | 11.9% | 10.4% |
| $50,000 to $74,999 | 18.8% | 17.1% | 15.7% |
| $75,000 to $99,999 | 12.6% | 13.2% | 12.7% |
| $100,000 to $149,999 | 12.6% | 16.9% | 17.4% |
| $150,000 to $199,999 | 6.3% | 8.0% | 9.3% |
| $200,000 or more | 6.2% | 8.5% | 12.6% |


