Germantown SnackAbility
Overall SnackAbility
Crime in Germantown summary. We use data from the FBI to determine the crime rates in Germantown. Key points include:
There were 51 total crimes in Germantown in the last reporting year.
The overall crime rate per 100,000 people in Germantown is 877.8 / 100k people.
The violent crime rate per 100,000 people in Germantown is 103.3 / 100k people.
The property crime rate per 100,000 people in Germantown is 774.5 / 100k people.
Overall, crime in Germantown is -58.58% below the national average.
Total Crimes
Below National Average
Crime In Germantown Comparison Table
| Statistic | Count Raw |
Germantown / 100k People |
Ohio / 100k People |
National / 100k People |
|---|---|---|---|---|
| Total Crimes Per 100K | 51 | 877.8 | 1,844.9 | 2,119.2 |
| Violent Crime | 6 | 103.3 | 293.7 | 359.0 |
| Murder | 0 | 0.0 | 5.0 | 5.0 |
| Robbery | 0 | 0.0 | 45.5 | 61.0 |
| Aggravated Assault | 4 | 68.8 | 197.4 | 256.0 |
| Property Crime | 45 | 774.5 | 1,551.2 | 1,760.0 |
| Burglary | 8 | 137.7 | 206.0 | 229.0 |
| Larceny | 33 | 568.0 | 1,132.8 | 1,272.0 |
| Car Theft | 4 | 68.8 | 212.5 | 259.0 |
Source: FBI Uniform Crime Reporting (2024)
Cost of living in Germantown summary. We use data on the cost of living to determine how expensive it is to live in Germantown. Real estate prices drive most of the variance in cost of living around Ohio. Key points include:
The cost of living in Germantown is 94 with 100 being average.
The cost of living in Germantown is 0.9x lower than the national average.
The median home value in Germantown is $265,381.
The median income in Germantown is $90,125.
Germantown's Overall Cost Of Living
Lower Than The National Average
Cost Of Living In Germantown Comparison Table
| Living Expense | Germantown | Ohio | National Average |
|---|---|---|---|
| Overall | 94 | 90 | 100 |
| Services | 98 | 97 | 100 |
| Groceries | 97 | 97 | 100 |
| Health | 83 | 75 | 100 |
| Housing | 99 | 97 | 100 |
| Transportation | 95 | 95 | 100 |
| Utilities | 99 | 97 | 100 |
Source: Cost of living index, normalized to US average = 100
Germantown, OH Weather
The average high in Germantown is 62.3° and the average low is 43.0°.
There are 76.7 days of precipitation each year.
Expect an average of 40.4 inches of precipitation each year with 15.6 inches of snow.
| Stat | Germantown |
|---|---|
| Average Annual High | 62.3 |
| Average Annual Low | 43.0 |
| Annual Precipitation Days | 76.7 |
| Average Annual Precipitation | 40.4 |
| Average Annual Snowfall | 15.6 |
Average High
Days of Rain
Source: NOAA climate normals (30-year)
Germantown, OH Photos


Rankings & Articles For Germantown


Locations Around Germantown
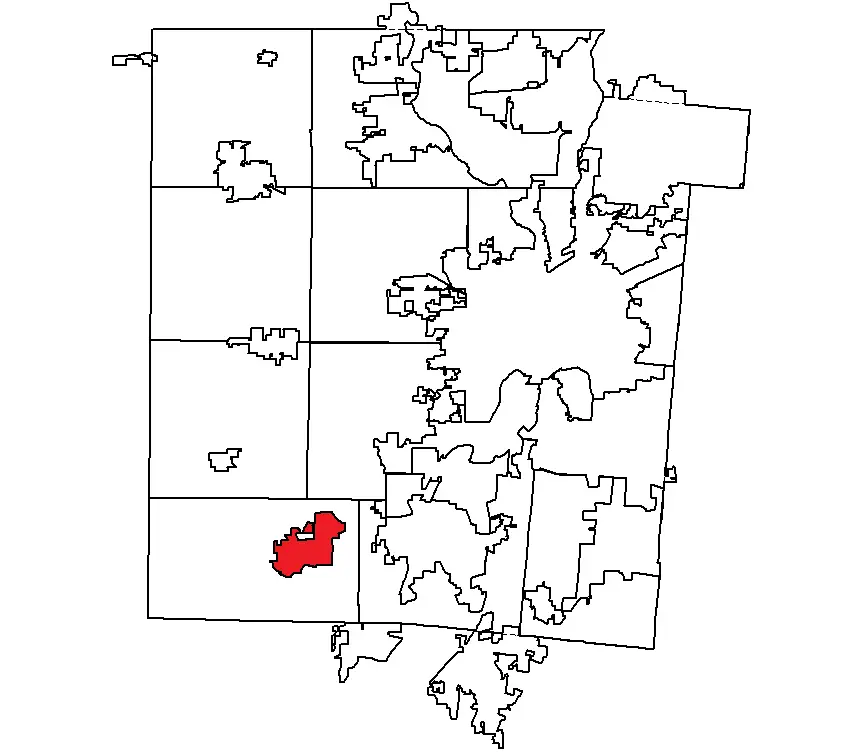
Map Of Germantown, OH
Best Places Around Germantown
Mason, OH
Population 35,509
Springboro, OH
Population 19,980
Bellbrook, OH
Population 7,394
Beavercreek, OH
Population 47,126
Oakwood, OH
Population 9,458
Kettering, OH
Population 57,206
Centerville, OH
Population 25,205
Centerville, OH
Population 25,205
Lebanon, OH
Population 21,501
Trenton, OH
Population 13,583
Germantown Demographics And Statistics
Population over time in Germantown
| Year | Population | % Change |
|---|---|---|
| 2024 | 5,825 | 0.5% |
| 2023 | 5,796 | 0.2% |
| 2022 | 5,784 | 0.6% |
| 2021 | 5,748 | 3.9% |
| 2020 | 5,530 | 0.5% |
| 2019 | 5,502 | -0.1% |
| 2018 | 5,505 | 0.1% |
| 2017 | 5,500 | -0.1% |
| 2016 | 5,503 | -0.3% |
| 2015 | 5,521 | -0.4% |
| 2014 | 5,545 | 0.4% |
| 2013 | 5,523 | 0.5% |
| 2012 | 5,494 | - |
| 2011 | 0 | - |
| 2010 | 0 | - |
Race / Ethnicity in Germantown
See the full breakdown
Germantown is:
94.0% White with 5,474 White residents.
0.0% African American with 0 African American residents.
0.0% American Indian with 0 American Indian residents.
0.0% Asian with 0 Asian residents.
0.0% Hawaiian with 0 Hawaiian residents.
0.0% Other with 0 Other residents.
3.4% Two Or More with 200 Two Or More residents.
2.6% Hispanic with 151 Hispanic residents.
| Race | Germantown | OH | USA |
|---|---|---|---|
| White | 94.0% | 75.8% | 57.4% |
| African American | 0.0% | 12.0% | 11.9% |
| American Indian | 0.0% | 0.1% | 0.5% |
| Asian | 0.0% | 2.5% | 5.9% |
| Hawaiian | 0.0% | 0.0% | 0.2% |
| Other | 0.0% | 0.4% | 0.6% |
| Two Or More | 3.4% | 4.3% | 4.3% |
| Hispanic | 2.6% | 4.8% | 19.3% |
Gender in Germantown
See the full breakdown
Germantown is 49.6% female with 2,887 female residents.
Germantown is 50.4% male with 2,938 male residents.
| Gender | Germantown | OH | USA |
|---|---|---|---|
| Female | 49.6% | 50.7% | 50.5% |
| Male | 50.4% | 49.3% | 49.5% |
Highest level of educational attainment in Germantown for adults over 25
See the full breakdown
2.0% of adults in Germantown completed < 9th grade.
1.0% of adults in Germantown completed 9-12th grade.
34.0% of adults in Germantown completed high school / ged.
21.0% of adults in Germantown completed some college.
14.0% of adults in Germantown completed associate's degree.
16.0% of adults in Germantown completed bachelor's degree.
10.0% of adults in Germantown completed master's degree.
1.0% of adults in Germantown completed professional degree.
1.0% of adults in Germantown completed doctorate degree.
| Education | Germantown | OH | USA |
|---|---|---|---|
| < 9th Grade | 2.0% | 3.0% | 4.0% |
| 9-12th Grade | 1.0% | 6.0% | 6.0% |
| High School / GED | 34.0% | 32.0% | 26.0% |
| Some College | 21.0% | 19.0% | 19.0% |
| Associate's Degree | 14.0% | 9.0% | 9.0% |
| Bachelor's Degree | 16.0% | 19.0% | 22.0% |
| Master's Degree | 10.0% | 9.0% | 10.0% |
| Professional Degree | 1.0% | 2.0% | 2.0% |
| Doctorate Degree | 1.0% | 1.0% | 2.0% |
Household Income For Germantown, Ohio
See the full breakdown
2.7% of households in Germantown earn Less than $10,000.
4.2% of households in Germantown earn $10,000 to $14,999.
8.7% of households in Germantown earn $15,000 to $24,999.
3.2% of households in Germantown earn $25,000 to $34,999.
8.6% of households in Germantown earn $35,000 to $49,999.
12.5% of households in Germantown earn $50,000 to $74,999.
14.8% of households in Germantown earn $75,000 to $99,999.
27.3% of households in Germantown earn $100,000 to $149,999.
11.6% of households in Germantown earn $150,000 to $199,999.
6.5% of households in Germantown earn $200,000 or more.
| Income | Germantown | OH | USA |
|---|---|---|---|
| Less than $10,000 | 2.7% | 5.2% | 5.0% |
| $10,000 to $14,999 | 4.2% | 4.0% | 3.4% |
| $15,000 to $24,999 | 8.7% | 7.1% | 6.3% |
| $25,000 to $34,999 | 3.2% | 7.5% | 6.6% |
| $35,000 to $49,999 | 8.6% | 11.6% | 10.1% |
| $50,000 to $74,999 | 12.5% | 16.9% | 15.5% |
| $75,000 to $99,999 | 14.8% | 13.1% | 12.6% |
| $100,000 to $149,999 | 27.3% | 17.1% | 17.5% |
| $150,000 to $199,999 | 11.6% | 8.3% | 9.6% |
| $200,000 or more | 6.5% | 9.1% | 13.4% |
Source: U.S. Census ACS 5-year estimates (2024)


