Oxford SnackAbility
Overall SnackAbility
Cost of living in Oxford summary. We use data on the cost of living to determine how expensive it is to live in Oxford. Real estate prices drive most of the variance in cost of living around Ohio. Key points include:
The cost of living in Oxford is 98 with 100 being average.
The cost of living in Oxford is 1.0x lower than the national average.
The median home value in Oxford is $334,773.
The median income in Oxford is $40,764.
Oxford's Overall Cost Of Living
Lower Than The National Average
Cost Of Living In Oxford Comparison Table
| Living Expense | Oxford | Ohio | National Average |
|---|---|---|---|
| Overall | 98 | 90 | 100 |
| Services | 100 | 97 | 100 |
| Groceries | 94 | 97 | 100 |
| Health | 100 | 75 | 100 |
| Housing | 96 | 97 | 100 |
| Transportation | 98 | 95 | 100 |
| Utilities | 100 | 97 | 100 |
Source: Cost of living index, normalized to US average = 100
Oxford, OH Weather
The average high in Oxford is 64.1° and the average low is 43.0°.
There are 76.8 days of precipitation each year.
Expect an average of 40.8 inches of precipitation each year with 13.5 inches of snow.
| Stat | Oxford |
|---|---|
| Average Annual High | 64.1 |
| Average Annual Low | 43.0 |
| Annual Precipitation Days | 76.8 |
| Average Annual Precipitation | 40.8 |
| Average Annual Snowfall | 13.5 |
Average High
Days of Rain
Source: NOAA climate normals (30-year)
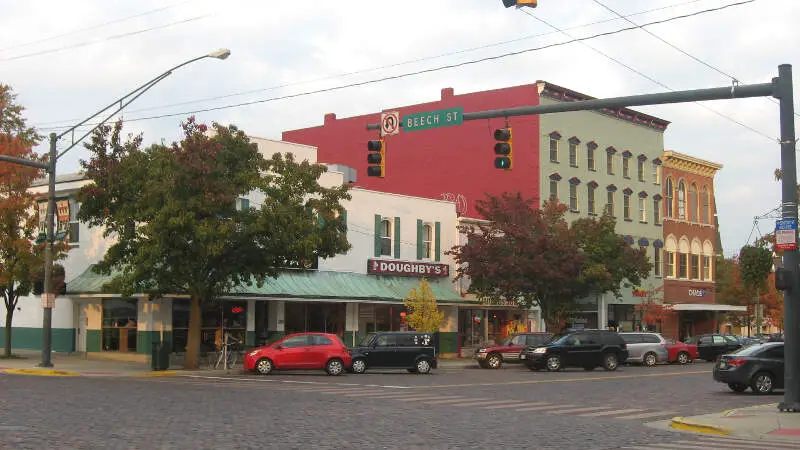
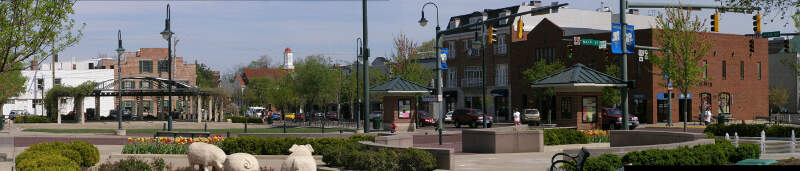
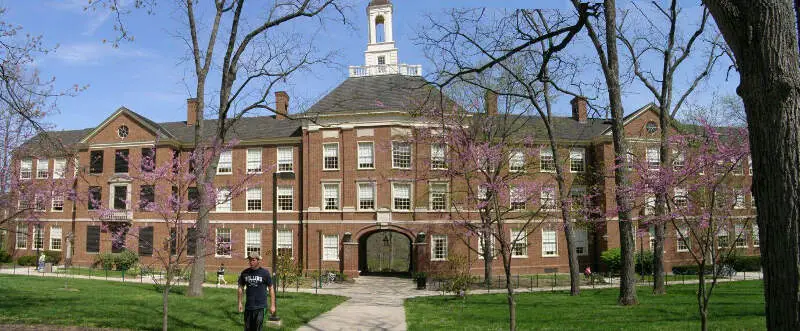
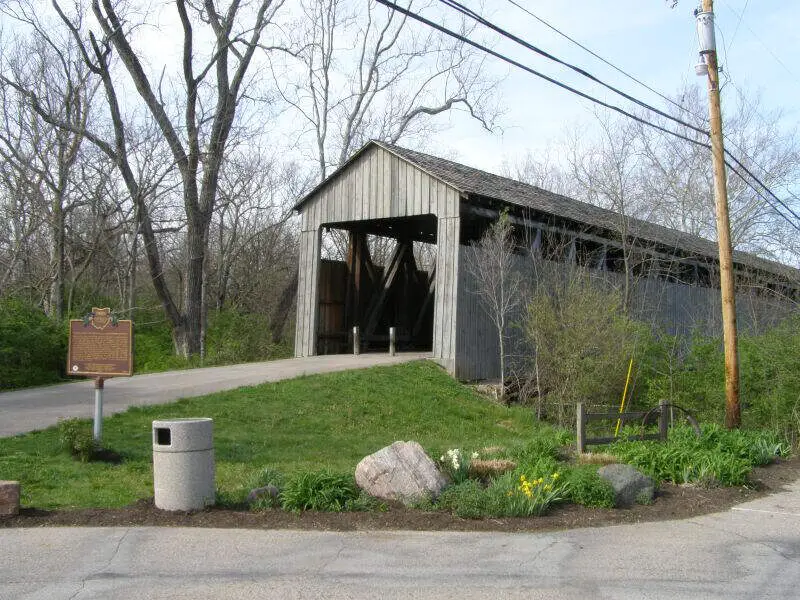
Oxford, OH Photos
Rankings & Articles For Oxford


Locations Around Oxford
Map Of Oxford, OH
Best Places Around Oxford
Harrison, OH
Population 13,084
Beckett Ridge, OH
Population 9,496
Northgate, OH
Population 6,723
Forest Park, OH
Population 20,025
Trenton, OH
Population 13,583
Fairfield, OH
Population 44,828
Northbrook, OH
Population 10,742
Hamilton, OH
Population 63,468
Eaton, OH
Population 8,339
Oxford Demographics And Statistics
Population over time in Oxford
The current population in Oxford is 21,753. The population has increased 1.0% from 2010.
| Year | Population | % Change |
|---|---|---|
| 2024 | 21,753 | -1.4% |
| 2023 | 22,069 | 0.1% |
| 2022 | 22,051 | -3.2% |
| 2021 | 22,783 | -1.8% |
| 2020 | 23,192 | 2.2% |
| 2019 | 22,700 | 0.4% |
| 2018 | 22,612 | -0.1% |
| 2017 | 22,624 | 3.1% |
| 2016 | 21,941 | 0.8% |
| 2015 | 21,762 | 1.0% |
| 2014 | 21,552 | -0.3% |
| 2013 | 21,608 | 1.3% |
| 2012 | 21,338 | -0.7% |
| 2011 | 21,492 | -0.2% |
| 2010 | 21,532 | - |
Race / Ethnicity in Oxford
See the full breakdown
Oxford is:
77.5% White with 16,848 White residents.
5.7% African American with 1,243 African American residents.
0.2% American Indian with 34 American Indian residents.
7.9% Asian with 1,723 Asian residents.
0.0% Hawaiian with 0 Hawaiian residents.
0.8% Other with 179 Other residents.
5.5% Two Or More with 1,205 Two Or More residents.
2.4% Hispanic with 521 Hispanic residents.
| Race | Oxford | OH | USA |
|---|---|---|---|
| White | 77.5% | 75.8% | 57.4% |
| African American | 5.7% | 12.0% | 11.9% |
| American Indian | 0.2% | 0.1% | 0.5% |
| Asian | 7.9% | 2.5% | 5.9% |
| Hawaiian | 0.0% | 0.0% | 0.2% |
| Other | 0.8% | 0.4% | 0.6% |
| Two Or More | 5.5% | 4.3% | 4.3% |
| Hispanic | 2.4% | 4.8% | 19.3% |
Gender in Oxford
See the full breakdown
Oxford is 52.2% female with 11,353 female residents.
Oxford is 47.8% male with 10,399 male residents.
| Gender | Oxford | OH | USA |
|---|---|---|---|
| Female | 52.2% | 50.7% | 50.5% |
| Male | 47.8% | 49.3% | 49.5% |
Highest level of educational attainment in Oxford for adults over 25
See the full breakdown
1.0% of adults in Oxford completed < 9th grade.
2.0% of adults in Oxford completed 9-12th grade.
20.0% of adults in Oxford completed high school / ged.
12.0% of adults in Oxford completed some college.
4.0% of adults in Oxford completed associate's degree.
24.0% of adults in Oxford completed bachelor's degree.
14.0% of adults in Oxford completed master's degree.
3.0% of adults in Oxford completed professional degree.
20.0% of adults in Oxford completed doctorate degree.
| Education | Oxford | OH | USA |
|---|---|---|---|
| < 9th Grade | 1.0% | 3.0% | 4.0% |
| 9-12th Grade | 2.0% | 6.0% | 6.0% |
| High School / GED | 20.0% | 32.0% | 26.0% |
| Some College | 12.0% | 19.0% | 19.0% |
| Associate's Degree | 4.0% | 9.0% | 9.0% |
| Bachelor's Degree | 24.0% | 19.0% | 22.0% |
| Master's Degree | 14.0% | 9.0% | 10.0% |
| Professional Degree | 3.0% | 2.0% | 2.0% |
| Doctorate Degree | 20.0% | 1.0% | 2.0% |
Household Income For Oxford, Ohio
See the full breakdown
13.4% of households in Oxford earn Less than $10,000.
9.9% of households in Oxford earn $10,000 to $14,999.
10.9% of households in Oxford earn $15,000 to $24,999.
9.3% of households in Oxford earn $25,000 to $34,999.
13.7% of households in Oxford earn $35,000 to $49,999.
9.4% of households in Oxford earn $50,000 to $74,999.
7.4% of households in Oxford earn $75,000 to $99,999.
14.2% of households in Oxford earn $100,000 to $149,999.
7.4% of households in Oxford earn $150,000 to $199,999.
4.4% of households in Oxford earn $200,000 or more.
| Income | Oxford | OH | USA |
|---|---|---|---|
| Less than $10,000 | 13.4% | 5.2% | 5.0% |
| $10,000 to $14,999 | 9.9% | 4.0% | 3.4% |
| $15,000 to $24,999 | 10.9% | 7.1% | 6.3% |
| $25,000 to $34,999 | 9.3% | 7.5% | 6.6% |
| $35,000 to $49,999 | 13.7% | 11.6% | 10.1% |
| $50,000 to $74,999 | 9.4% | 16.9% | 15.5% |
| $75,000 to $99,999 | 7.4% | 13.1% | 12.6% |
| $100,000 to $149,999 | 14.2% | 17.1% | 17.5% |
| $150,000 to $199,999 | 7.4% | 8.3% | 9.6% |
| $200,000 or more | 4.4% | 9.1% | 13.4% |
Source: U.S. Census ACS 5-year estimates (2024)


