Sandusky SnackAbility
Overall SnackAbility
Crime in Sandusky summary. We use data from the FBI to determine the crime rates in Sandusky. Key points include:
There were 714 total crimes in Sandusky in the last reporting year.
The overall crime rate per 100,000 people in Sandusky is 2,977.4 / 100k people.
The violent crime rate per 100,000 people in Sandusky is 387.8 / 100k people.
The property crime rate per 100,000 people in Sandusky is 2,589.6 / 100k people.
Overall, crime in Sandusky is 40.49% above the national average.
Total Crimes
Above National Average
Crime In Sandusky Comparison Table
| Statistic | Count Raw |
Sandusky / 100k People |
Ohio / 100k People |
National / 100k People |
|---|---|---|---|---|
| Total Crimes Per 100K | 714 | 2,977.4 | 1,844.9 | 2,119.2 |
| Violent Crime | 93 | 387.8 | 293.7 | 359.0 |
| Murder | 3 | 12.5 | 5.0 | 5.0 |
| Robbery | 12 | 50.0 | 45.5 | 61.0 |
| Aggravated Assault | 66 | 275.2 | 197.4 | 256.0 |
| Property Crime | 621 | 2,589.6 | 1,551.2 | 1,760.0 |
| Burglary | 95 | 396.1 | 206.0 | 229.0 |
| Larceny | 495 | 2,064.1 | 1,132.8 | 1,272.0 |
| Car Theft | 31 | 129.3 | 212.5 | 259.0 |
Source: FBI Uniform Crime Reporting (2024)
Cost of living in Sandusky summary. We use data on the cost of living to determine how expensive it is to live in Sandusky. Real estate prices drive most of the variance in cost of living around Ohio. Key points include:
The cost of living in Sandusky is 83 with 100 being average.
The cost of living in Sandusky is 0.8x lower than the national average.
The median home value in Sandusky is $146,646.
The median income in Sandusky is $50,139.
Sandusky's Overall Cost Of Living
Lower Than The National Average
Cost Of Living In Sandusky Comparison Table
| Living Expense | Sandusky | Ohio | National Average |
|---|---|---|---|
| Overall | 83 | 90 | 100 |
| Services | 96 | 97 | 100 |
| Groceries | 95 | 97 | 100 |
| Health | 54 | 75 | 100 |
| Housing | 99 | 97 | 100 |
| Transportation | 94 | 95 | 100 |
| Utilities | 96 | 97 | 100 |
Source: Cost of living index, normalized to US average = 100
Sandusky, OH Weather
The average high in Sandusky is 58.2° and the average low is 42.6°.
There are 69.4 days of precipitation each year.
Expect an average of 32.8 inches of precipitation each year with 18.0 inches of snow.
| Stat | Sandusky |
|---|---|
| Average Annual High | 58.2 |
| Average Annual Low | 42.6 |
| Annual Precipitation Days | 69.4 |
| Average Annual Precipitation | 32.8 |
| Average Annual Snowfall | 18.0 |
Average High
Days of Rain
Source: NOAA climate normals (30-year)
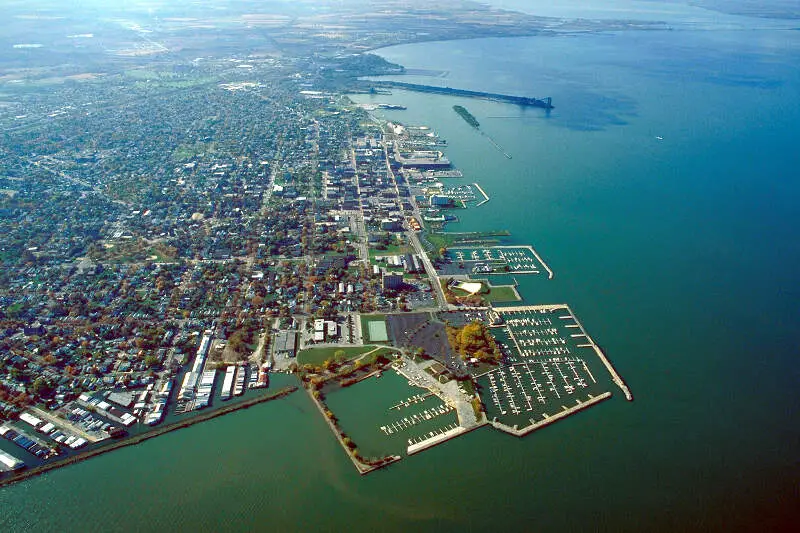
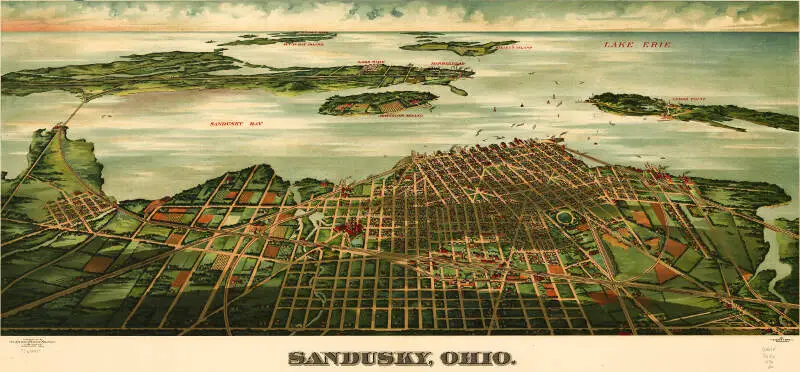
Sandusky, OH Photos


1 Reviews & Comments About Sandusky

There is no better amusement park than Cedar Point - which is why people come from all over the country to visit it. There is also a water park and plenty of indoor water parks nearby. Don't worry about being hungry because you can find places to eat everywhere! Your whole family can enjoy this family-friendly trip!!
Cedar Point has Camp Snoopy for the little ones. The water park is perfect for every member of your family. If you want to spend the night, consider Hotel Breakers which is a tradition with beautiful views and a convenient location for everything.
Rankings & Articles For Sandusky


Locations Around Sandusky
Map Of Sandusky, OH
Best Places Around Sandusky
Huron, OH
Population 6,757
Port Clinton, OH
Population 5,970
Bellevue, OH
Population 8,187
Clyde, OH
Population 6,331
Norwalk, OH
Population 17,095
Sandusky Demographics And Statistics
Population over time in Sandusky
The current population in Sandusky is 24,606. The population has decreased 5.9% from 2010.
| Year | Population | % Change |
|---|---|---|
| 2024 | 24,606 | -0.6% |
| 2023 | 24,748 | -0.9% |
| 2022 | 24,964 | -0.4% |
| 2021 | 25,066 | 1.7% |
| 2020 | 24,651 | -0.7% |
| 2019 | 24,829 | -0.7% |
| 2018 | 25,012 | -0.5% |
| 2017 | 25,139 | -0.8% |
| 2016 | 25,338 | -0.6% |
| 2015 | 25,488 | -0.5% |
| 2014 | 25,626 | 0.1% |
| 2013 | 25,606 | -0.7% |
| 2012 | 25,787 | -0.8% |
| 2011 | 25,984 | -0.6% |
| 2010 | 26,147 | - |
Race / Ethnicity in Sandusky
See the full breakdown
Sandusky is:
60.4% White with 14,857 White residents.
21.7% African American with 5,351 African American residents.
0.1% American Indian with 25 American Indian residents.
1.8% Asian with 440 Asian residents.
0.0% Hawaiian with 0 Hawaiian residents.
3.2% Other with 793 Other residents.
6.6% Two Or More with 1,630 Two Or More residents.
6.1% Hispanic with 1,510 Hispanic residents.
| Race | Sandusky | OH | USA |
|---|---|---|---|
| White | 60.4% | 75.8% | 57.4% |
| African American | 21.7% | 12.0% | 11.9% |
| American Indian | 0.1% | 0.1% | 0.5% |
| Asian | 1.8% | 2.5% | 5.9% |
| Hawaiian | 0.0% | 0.0% | 0.2% |
| Other | 3.2% | 0.4% | 0.6% |
| Two Or More | 6.6% | 4.3% | 4.3% |
| Hispanic | 6.1% | 4.8% | 19.3% |
Gender in Sandusky
See the full breakdown
Sandusky is 53.1% female with 13,074 female residents.
Sandusky is 46.9% male with 11,532 male residents.
| Gender | Sandusky | OH | USA |
|---|---|---|---|
| Female | 53.1% | 50.7% | 50.5% |
| Male | 46.9% | 49.3% | 49.5% |
Highest level of educational attainment in Sandusky for adults over 25
See the full breakdown
2.0% of adults in Sandusky completed < 9th grade.
8.0% of adults in Sandusky completed 9-12th grade.
41.0% of adults in Sandusky completed high school / ged.
17.0% of adults in Sandusky completed some college.
10.0% of adults in Sandusky completed associate's degree.
14.0% of adults in Sandusky completed bachelor's degree.
6.0% of adults in Sandusky completed master's degree.
1.0% of adults in Sandusky completed professional degree.
1.0% of adults in Sandusky completed doctorate degree.
| Education | Sandusky | OH | USA |
|---|---|---|---|
| < 9th Grade | 2.0% | 3.0% | 4.0% |
| 9-12th Grade | 8.0% | 6.0% | 6.0% |
| High School / GED | 41.0% | 32.0% | 26.0% |
| Some College | 17.0% | 19.0% | 19.0% |
| Associate's Degree | 10.0% | 9.0% | 9.0% |
| Bachelor's Degree | 14.0% | 19.0% | 22.0% |
| Master's Degree | 6.0% | 9.0% | 10.0% |
| Professional Degree | 1.0% | 2.0% | 2.0% |
| Doctorate Degree | 1.0% | 1.0% | 2.0% |
Household Income For Sandusky, Ohio
See the full breakdown
8.2% of households in Sandusky earn Less than $10,000.
8.3% of households in Sandusky earn $10,000 to $14,999.
9.6% of households in Sandusky earn $15,000 to $24,999.
12.0% of households in Sandusky earn $25,000 to $34,999.
11.8% of households in Sandusky earn $35,000 to $49,999.
16.2% of households in Sandusky earn $50,000 to $74,999.
14.8% of households in Sandusky earn $75,000 to $99,999.
13.7% of households in Sandusky earn $100,000 to $149,999.
2.9% of households in Sandusky earn $150,000 to $199,999.
2.6% of households in Sandusky earn $200,000 or more.
| Income | Sandusky | OH | USA |
|---|---|---|---|
| Less than $10,000 | 8.2% | 5.2% | 5.0% |
| $10,000 to $14,999 | 8.3% | 4.0% | 3.4% |
| $15,000 to $24,999 | 9.6% | 7.1% | 6.3% |
| $25,000 to $34,999 | 12.0% | 7.5% | 6.6% |
| $35,000 to $49,999 | 11.8% | 11.6% | 10.1% |
| $50,000 to $74,999 | 16.2% | 16.9% | 15.5% |
| $75,000 to $99,999 | 14.8% | 13.1% | 12.6% |
| $100,000 to $149,999 | 13.7% | 17.1% | 17.5% |
| $150,000 to $199,999 | 2.9% | 8.3% | 9.6% |
| $200,000 or more | 2.6% | 9.1% | 13.4% |
Source: U.S. Census ACS 5-year estimates (2024)


