Bellevue, OH
Demographics And Statistics
Living In Bellevue, Ohio Summary
Life in Bellevue research summary. HomeSnacks has been using Saturday Night Science to research the quality of life in Bellevue over the past nine years using Census, FBI, Zillow, and other primary data sources. Based on the most recently available data, we found the following about life in Bellevue:
The population in Bellevue is 8,201.
The median home value in Bellevue is $182,467.
The median income in Bellevue is $57,534.
The cost of living in Bellevue is 87 which is 0.9x lower than the national average.
The median rent in Bellevue is $733.
The unemployment rate in Bellevue is 5.2%.
The poverty rate in Bellevue is 14.9%.
The average high in Bellevue is 59.4° and the average low is 40.3°.
Table Of Contents
Bellevue SnackAbility
Overall SnackAbility
Bellevue, OH Cost Of Living
Cost of living in Bellevue summary. We use data on the cost of living to determine how expensive it is to live in Bellevue. Real estate prices drive most of the variance in cost of living around Ohio. Key points include:
The cost of living in Bellevue is 87 with 100 being average.
The cost of living in Bellevue is 0.9x lower than the national average.
The median home value in Bellevue is $182,467.
The median income in Bellevue is $57,534.
Bellevue's Overall Cost Of Living
Lower Than The National Average
Cost Of Living In Bellevue Comparison Table
| Living Expense | Bellevue | Ohio | National Average | |
|---|---|---|---|---|
| Overall | 87 | 93 | 100 | |
| Services | 104 | 101 | 100 | |
| Groceries | 99 | 103 | 100 | |
| Health | 88 | 97 | 100 | |
| Housing | 62 | 74 | 100 | |
| Transportation | 99 | 102 | 100 | |
| Utilities | 92 | 100 | 100 | |
Bellevue, OH Weather
The average high in Bellevue is 59.4° and the average low is 40.3°.
There are 69.4 days of precipitation each year.
Expect an average of 37.3 inches of precipitation each year with 24.2 inches of snow.
| Stat | Bellevue |
|---|---|
| Average Annual High | 59.4 |
| Average Annual Low | 40.3 |
| Annual Precipitation Days | 69.4 |
| Average Annual Precipitation | 37.3 |
| Average Annual Snowfall | 24.2 |
Average High
Days of Rain
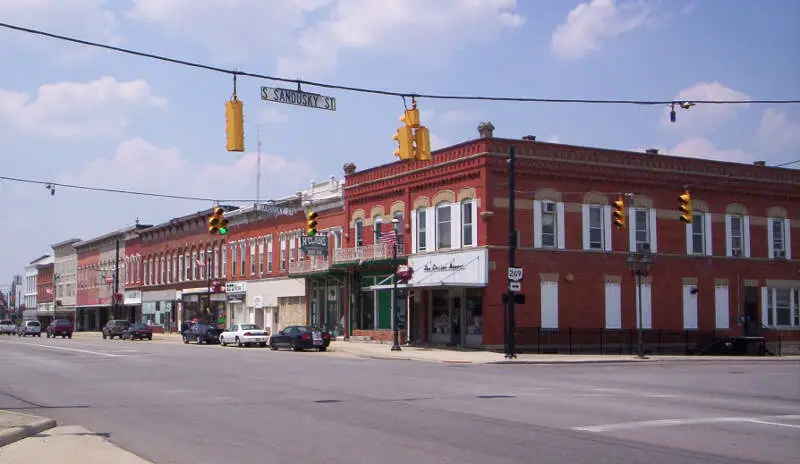
Bellevue, OH Photos
Bellevue Articles

Rankings for Bellevue in Ohio


Locations Around Bellevue
Map Of Bellevue, OH
Best Places Around Bellevue
Huron, OH
Population 6,824
Port Clinton, OH
Population 5,999
Fremont, OH
Population 15,851
Sandusky, OH
Population 24,748
Clyde, OH
Population 6,322
Willard, OH
Population 6,174
Norwalk, OH
Population 17,054
Bellevue Demographics And Statistics
Population over time in Bellevue
The current population in Bellevue is 8,201. The population has decreased -1.0% from 2010.
| Year | Population | % Change |
|---|---|---|
| 2023 | 8,201 | -0.1% |
| 2022 | 8,210 | 0.1% |
| 2021 | 8,201 | 3.4% |
| 2020 | 7,928 | -0.1% |
| 2019 | 7,937 | -0.6% |
| 2018 | 7,987 | -0.2% |
| 2017 | 8,004 | -0.7% |
| 2016 | 8,059 | -0.6% |
| 2015 | 8,109 | -0.6% |
| 2014 | 8,157 | -0.3% |
| 2013 | 8,181 | -0.4% |
| 2012 | 8,211 | -0.4% |
| 2011 | 8,244 | -0.5% |
| 2010 | 8,282 | - |
Race / Ethnicity in Bellevue
Bellevue is:
88.1% White with 7,225 White residents.
0.8% African American with 63 African American residents.
0.0% American Indian with 0 American Indian residents.
1.1% Asian with 93 Asian residents.
0.0% Hawaiian with 0 Hawaiian residents.
0.7% Other with 55 Other residents.
1.4% Two Or More with 114 Two Or More residents.
7.9% Hispanic with 651 Hispanic residents.
| Race | Bellevue | OH | USA |
|---|---|---|---|
| White | 88.1% | 76.5% | 58.2% |
| African American | 0.8% | 12.1% | 12.0% |
| American Indian | 0.0% | 0.1% | 0.5% |
| Asian | 1.1% | 2.4% | 5.7% |
| Hawaiian | 0.0% | 0.0% | 0.2% |
| Other | 0.7% | 0.4% | 0.5% |
| Two Or More | 1.4% | 3.9% | 3.9% |
| Hispanic | 7.9% | 4.6% | 19.0% |
Gender in Bellevue
Bellevue is 47.6% female with 3,903 female residents.
Bellevue is 52.4% male with 4,298 male residents.
| Gender | Bellevue | OH | USA |
|---|---|---|---|
| Female | 47.6% | 50.7% | 50.5% |
| Male | 52.4% | 49.3% | 49.5% |
Highest level of educational attainment in Bellevue for adults over 25
2.0% of adults in Bellevue completed < 9th grade.
7.0% of adults in Bellevue completed 9-12th grade.
43.0% of adults in Bellevue completed high school / ged.
23.0% of adults in Bellevue completed some college.
8.0% of adults in Bellevue completed associate's degree.
10.0% of adults in Bellevue completed bachelor's degree.
5.0% of adults in Bellevue completed master's degree.
1.0% of adults in Bellevue completed professional degree.
1.0% of adults in Bellevue completed doctorate degree.
| Education | Bellevue | OH | USA |
|---|---|---|---|
| < 9th Grade | 2.0% | 3.0% | 5.0% |
| 9-12th Grade | 7.0% | 6.0% | 6.0% |
| High School / GED | 43.0% | 32.0% | 26.0% |
| Some College | 23.0% | 19.0% | 19.0% |
| Associate's Degree | 8.0% | 9.0% | 9.0% |
| Bachelor's Degree | 10.0% | 19.0% | 21.0% |
| Master's Degree | 5.0% | 9.0% | 10.0% |
| Professional Degree | 1.0% | 2.0% | 2.0% |
| Doctorate Degree | 1.0% | 1.0% | 2.0% |
Household Income For Bellevue, Ohio
4.2% of households in Bellevue earn Less than $10,000.
7.5% of households in Bellevue earn $10,000 to $14,999.
11.7% of households in Bellevue earn $15,000 to $24,999.
8.1% of households in Bellevue earn $25,000 to $34,999.
14.4% of households in Bellevue earn $35,000 to $49,999.
18.5% of households in Bellevue earn $50,000 to $74,999.
13.2% of households in Bellevue earn $75,000 to $99,999.
15.0% of households in Bellevue earn $100,000 to $149,999.
2.6% of households in Bellevue earn $150,000 to $199,999.
4.7% of households in Bellevue earn $200,000 or more.
| Income | Bellevue | OH | USA |
|---|---|---|---|
| Less than $10,000 | 4.2% | 5.2% | 4.9% |
| $10,000 to $14,999 | 7.5% | 4.1% | 3.6% |
| $15,000 to $24,999 | 11.7% | 7.4% | 6.6% |
| $25,000 to $34,999 | 8.1% | 7.7% | 6.8% |
| $35,000 to $49,999 | 14.4% | 11.9% | 10.4% |
| $50,000 to $74,999 | 18.5% | 17.1% | 15.7% |
| $75,000 to $99,999 | 13.2% | 13.2% | 12.7% |
| $100,000 to $149,999 | 15.0% | 16.9% | 17.4% |
| $150,000 to $199,999 | 2.6% | 8.0% | 9.3% |
| $200,000 or more | 4.7% | 8.5% | 12.6% |


