St. Marys SnackAbility
Overall SnackAbility
Crime in St. Marys summary. We use data from the FBI to determine the crime rates in St. Marys. Key points include:
There were 61 total crimes in St. Marys in the last reporting year.
The overall crime rate per 100,000 people in St. Marys is 753.6 / 100k people.
The violent crime rate per 100,000 people in St. Marys is 37.1 / 100k people.
The property crime rate per 100,000 people in St. Marys is 716.6 / 100k people.
Overall, crime in St. Marys is -64.44% below the national average.
Total Crimes
Below National Average
Crime In St. Marys Comparison Table
| Statistic | Count Raw |
St. Marys / 100k People |
Ohio / 100k People |
National / 100k People |
|---|---|---|---|---|
| Total Crimes Per 100K | 61 | 753.6 | 1,844.9 | 2,119.2 |
| Violent Crime | 3 | 37.1 | 293.7 | 359.0 |
| Murder | 0 | 0.0 | 5.0 | 5.0 |
| Robbery | 0 | 0.0 | 45.5 | 61.0 |
| Aggravated Assault | 3 | 37.1 | 197.4 | 256.0 |
| Property Crime | 58 | 716.6 | 1,551.2 | 1,760.0 |
| Burglary | 12 | 148.3 | 206.0 | 229.0 |
| Larceny | 42 | 518.9 | 1,132.8 | 1,272.0 |
| Car Theft | 4 | 49.4 | 212.5 | 259.0 |
Source: FBI Uniform Crime Reporting (2024)
Cost of living in St. Marys summary. We use data on the cost of living to determine how expensive it is to live in St. Marys. Real estate prices drive most of the variance in cost of living around Ohio. Key points include:
The cost of living in St. Marys is 90 with 100 being average.
The cost of living in St. Marys is 0.9x lower than the national average.
The median home value in St. Marys is $204,180.
The median income in St. Marys is $79,516.
St. Marys's Overall Cost Of Living
Lower Than The National Average
Cost Of Living In St. Marys Comparison Table
| Living Expense | St. Marys | Ohio | National Average |
|---|---|---|---|
| Overall | 90 | 90 | 100 |
| Services | 99 | 97 | 100 |
| Groceries | 96 | 97 | 100 |
| Health | 70 | 75 | 100 |
| Housing | 95 | 97 | 100 |
| Transportation | 99 | 95 | 100 |
| Utilities | 94 | 97 | 100 |
Source: Cost of living index, normalized to US average = 100
St. Marys, OH Weather
The average high in St. Marys is 60.5° and the average low is 41.3°.
There are 74.8 days of precipitation each year.
Expect an average of 38.1 inches of precipitation each year with 19.7 inches of snow.
| Stat | St. Marys |
|---|---|
| Average Annual High | 60.5 |
| Average Annual Low | 41.3 |
| Annual Precipitation Days | 74.8 |
| Average Annual Precipitation | 38.1 |
| Average Annual Snowfall | 19.7 |
Average High
Days of Rain
Source: NOAA climate normals (30-year)
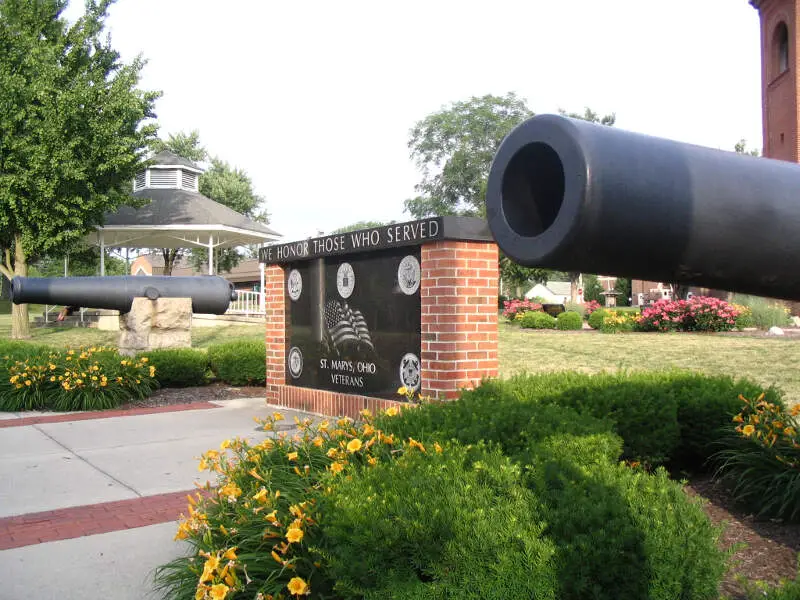
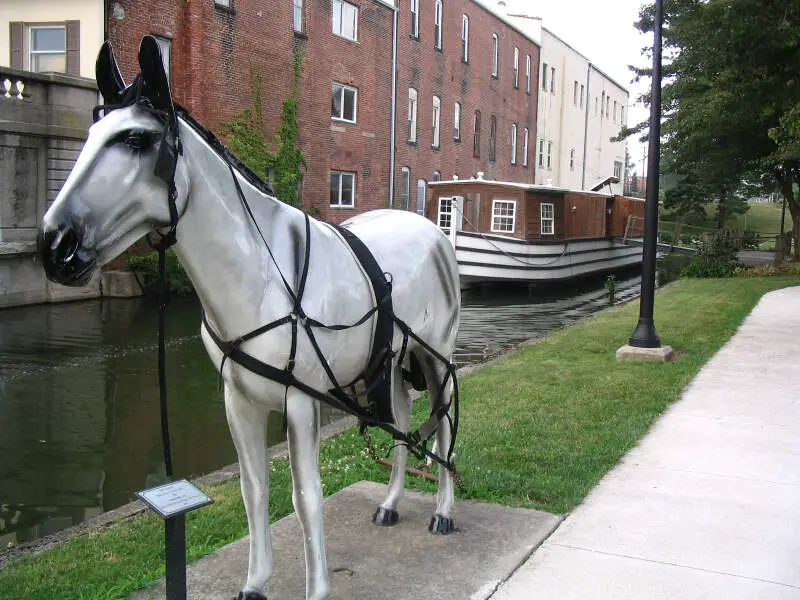
St. Marys, OH Photos


Rankings & Articles For St. Marys


Locations Around St. Marys
Map Of St. Marys, OH
Best Places Around St. Marys
Oakwood, OH
Population 9,458
Wapakoneta, OH
Population 9,894
Northridge, OH
Population 7,817
Ada, OH
Population 4,797
Clayton, OH
Population 13,277
Vandalia, OH
Population 15,053
Celina, OH
Population 10,903
Brookville, OH
Population 5,779
Huber Heights, OH
Population 43,455
Englewood, OH
Population 13,356
St. Marys Demographics And Statistics
Population over time in St. Marys
The current population in St. Marys is 8,301. The population has decreased 0.2% from 2010.
| Year | Population | % Change |
|---|---|---|
| 2024 | 8,301 | -0.2% |
| 2023 | 8,319 | -0.0% |
| 2022 | 8,323 | 0.1% |
| 2021 | 8,311 | 1.0% |
| 2020 | 8,227 | 0.3% |
| 2019 | 8,202 | 0.7% |
| 2018 | 8,145 | 0.0% |
| 2017 | 8,143 | -0.3% |
| 2016 | 8,169 | 0.6% |
| 2015 | 8,117 | -0.9% |
| 2014 | 8,193 | -0.5% |
| 2013 | 8,232 | -0.1% |
| 2012 | 8,241 | 0.4% |
| 2011 | 8,207 | -1.3% |
| 2010 | 8,317 | - |
Race / Ethnicity in St. Marys
See the full breakdown
St. Marys is:
90.9% White with 7,542 White residents.
1.7% African American with 142 African American residents.
0.0% American Indian with 0 American Indian residents.
0.1% Asian with 11 Asian residents.
0.0% Hawaiian with 0 Hawaiian residents.
0.0% Other with 0 Other residents.
1.4% Two Or More with 116 Two Or More residents.
5.9% Hispanic with 490 Hispanic residents.
| Race | St. Marys | OH | USA |
|---|---|---|---|
| White | 90.9% | 75.8% | 57.4% |
| African American | 1.7% | 12.0% | 11.9% |
| American Indian | 0.0% | 0.1% | 0.5% |
| Asian | 0.1% | 2.5% | 5.9% |
| Hawaiian | 0.0% | 0.0% | 0.2% |
| Other | 0.0% | 0.4% | 0.6% |
| Two Or More | 1.4% | 4.3% | 4.3% |
| Hispanic | 5.9% | 4.8% | 19.3% |
Gender in St. Marys
See the full breakdown
St. Marys is 49.9% female with 4,142 female residents.
St. Marys is 50.1% male with 4,159 male residents.
| Gender | St. Marys | OH | USA |
|---|---|---|---|
| Female | 49.9% | 50.7% | 50.5% |
| Male | 50.1% | 49.3% | 49.5% |
Highest level of educational attainment in St. Marys for adults over 25
See the full breakdown
0.0% of adults in St. Marys completed < 9th grade.
3.0% of adults in St. Marys completed 9-12th grade.
44.0% of adults in St. Marys completed high school / ged.
20.0% of adults in St. Marys completed some college.
15.0% of adults in St. Marys completed associate's degree.
13.0% of adults in St. Marys completed bachelor's degree.
5.0% of adults in St. Marys completed master's degree.
0.0% of adults in St. Marys completed professional degree.
0.0% of adults in St. Marys completed doctorate degree.
| Education | St. Marys | OH | USA |
|---|---|---|---|
| < 9th Grade | 0.0% | 3.0% | 4.0% |
| 9-12th Grade | 3.0% | 6.0% | 6.0% |
| High School / GED | 44.0% | 32.0% | 26.0% |
| Some College | 20.0% | 19.0% | 19.0% |
| Associate's Degree | 15.0% | 9.0% | 9.0% |
| Bachelor's Degree | 13.0% | 19.0% | 22.0% |
| Master's Degree | 5.0% | 9.0% | 10.0% |
| Professional Degree | 0.0% | 2.0% | 2.0% |
| Doctorate Degree | 0.0% | 1.0% | 2.0% |
Household Income For St. Marys, Ohio
See the full breakdown
3.5% of households in St. Marys earn Less than $10,000.
1.0% of households in St. Marys earn $10,000 to $14,999.
7.3% of households in St. Marys earn $15,000 to $24,999.
3.8% of households in St. Marys earn $25,000 to $34,999.
16.8% of households in St. Marys earn $35,000 to $49,999.
15.8% of households in St. Marys earn $50,000 to $74,999.
18.2% of households in St. Marys earn $75,000 to $99,999.
21.3% of households in St. Marys earn $100,000 to $149,999.
7.3% of households in St. Marys earn $150,000 to $199,999.
5.0% of households in St. Marys earn $200,000 or more.
| Income | St. Marys | OH | USA |
|---|---|---|---|
| Less than $10,000 | 3.5% | 5.2% | 5.0% |
| $10,000 to $14,999 | 1.0% | 4.0% | 3.4% |
| $15,000 to $24,999 | 7.3% | 7.1% | 6.3% |
| $25,000 to $34,999 | 3.8% | 7.5% | 6.6% |
| $35,000 to $49,999 | 16.8% | 11.6% | 10.1% |
| $50,000 to $74,999 | 15.8% | 16.9% | 15.5% |
| $75,000 to $99,999 | 18.2% | 13.1% | 12.6% |
| $100,000 to $149,999 | 21.3% | 17.1% | 17.5% |
| $150,000 to $199,999 | 7.3% | 8.3% | 9.6% |
| $200,000 or more | 5.0% | 9.1% | 13.4% |
Source: U.S. Census ACS 5-year estimates (2024)


