Brookville SnackAbility
Overall SnackAbility
Cost of living in Brookville summary. We use data on the cost of living to determine how expensive it is to live in Brookville. Real estate prices drive most of the variance in cost of living around Ohio. Key points include:
The cost of living in Brookville is 91 with 100 being average.
The cost of living in Brookville is 0.9x lower than the national average.
The median home value in Brookville is $265,951.
The median income in Brookville is $63,598.
Brookville's Overall Cost Of Living
Lower Than The National Average
Cost Of Living In Brookville Comparison Table
| Living Expense | Brookville | Ohio | National Average |
|---|---|---|---|
| Overall | 91 | 90 | 100 |
| Services | 98 | 97 | 100 |
| Groceries | 98 | 97 | 100 |
| Health | 72 | 75 | 100 |
| Housing | 96 | 97 | 100 |
| Transportation | 95 | 95 | 100 |
| Utilities | 95 | 97 | 100 |
Source: Cost of living index, normalized to US average = 100
Brookville, OH Weather
The average high in Brookville is 62.3° and the average low is 43.0°.
There are 76.7 days of precipitation each year.
Expect an average of 40.4 inches of precipitation each year with 15.6 inches of snow.
| Stat | Brookville |
|---|---|
| Average Annual High | 62.3 |
| Average Annual Low | 43.0 |
| Annual Precipitation Days | 76.7 |
| Average Annual Precipitation | 40.4 |
| Average Annual Snowfall | 15.6 |
Average High
Days of Rain
Source: NOAA climate normals (30-year)
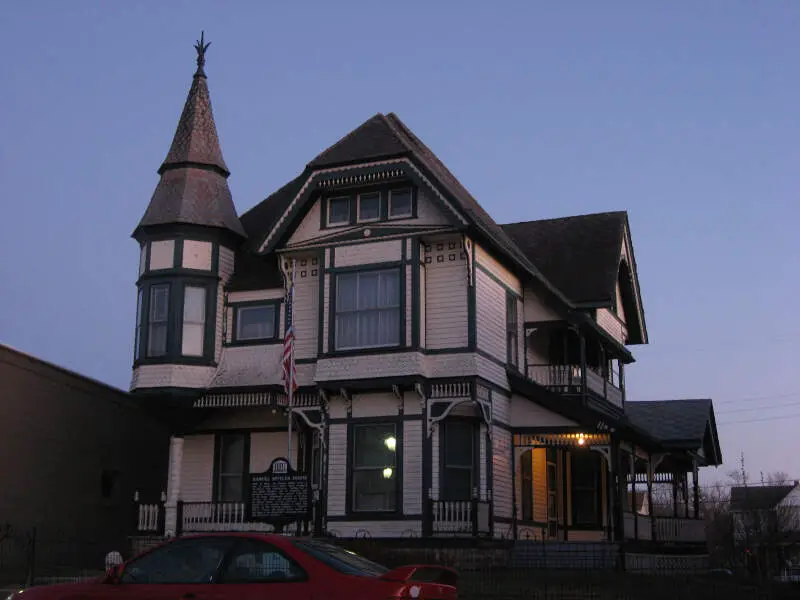
Brookville, OH Photos
Rankings & Articles For Brookville


Locations Around Brookville
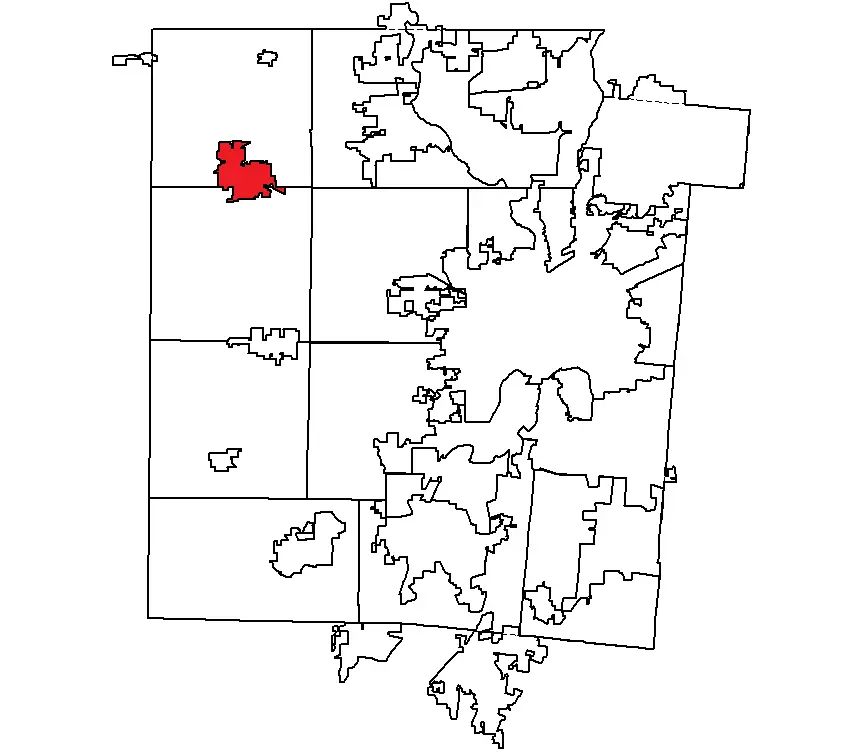
Map Of Brookville, OH
Best Places Around Brookville
Oakwood, OH
Population 9,458
Kettering, OH
Population 57,206
Germantown, OH
Population 5,825
Clayton, OH
Population 13,277
Vandalia, OH
Population 15,053
Miamisburg, OH
Population 19,948
Huber Heights, OH
Population 43,455
Englewood, OH
Population 13,356
Union, OH
Population 7,037
Troy, OH
Population 26,842
Brookville Demographics And Statistics
Population over time in Brookville
The current population in Brookville is 5,779. The population has increased 1.8% from 2010.
| Year | Population | % Change |
|---|---|---|
| 2024 | 5,779 | -7.3% |
| 2023 | 6,234 | 3.3% |
| 2022 | 6,035 | 1.1% |
| 2021 | 5,970 | -4.6% |
| 2020 | 6,255 | 5.7% |
| 2019 | 5,919 | 1.8% |
| 2018 | 5,813 | -2.5% |
| 2017 | 5,964 | -0.5% |
| 2016 | 5,993 | -1.4% |
| 2015 | 6,077 | -4.3% |
| 2014 | 6,351 | 3.1% |
| 2013 | 6,162 | 2.0% |
| 2012 | 6,044 | 3.8% |
| 2011 | 5,822 | 2.6% |
| 2010 | 5,675 | - |
Race / Ethnicity in Brookville
See the full breakdown
Brookville is:
90.1% White with 5,205 White residents.
0.5% African American with 31 African American residents.
0.0% American Indian with 0 American Indian residents.
4.9% Asian with 282 Asian residents.
0.0% Hawaiian with 0 Hawaiian residents.
0.3% Other with 16 Other residents.
3.5% Two Or More with 202 Two Or More residents.
0.7% Hispanic with 43 Hispanic residents.
| Race | Brookville | OH | USA |
|---|---|---|---|
| White | 90.1% | 75.8% | 57.4% |
| African American | 0.5% | 12.0% | 11.9% |
| American Indian | 0.0% | 0.1% | 0.5% |
| Asian | 4.9% | 2.5% | 5.9% |
| Hawaiian | 0.0% | 0.0% | 0.2% |
| Other | 0.3% | 0.4% | 0.6% |
| Two Or More | 3.5% | 4.3% | 4.3% |
| Hispanic | 0.7% | 4.8% | 19.3% |
Gender in Brookville
See the full breakdown
Brookville is 49.7% female with 2,875 female residents.
Brookville is 50.3% male with 2,904 male residents.
| Gender | Brookville | OH | USA |
|---|---|---|---|
| Female | 49.7% | 50.7% | 50.5% |
| Male | 50.3% | 49.3% | 49.5% |
Highest level of educational attainment in Brookville for adults over 25
See the full breakdown
3.0% of adults in Brookville completed < 9th grade.
4.0% of adults in Brookville completed 9-12th grade.
43.0% of adults in Brookville completed high school / ged.
22.0% of adults in Brookville completed some college.
6.0% of adults in Brookville completed associate's degree.
13.0% of adults in Brookville completed bachelor's degree.
9.0% of adults in Brookville completed master's degree.
0.0% of adults in Brookville completed professional degree.
0.0% of adults in Brookville completed doctorate degree.
| Education | Brookville | OH | USA |
|---|---|---|---|
| < 9th Grade | 3.0% | 3.0% | 4.0% |
| 9-12th Grade | 4.0% | 6.0% | 6.0% |
| High School / GED | 43.0% | 32.0% | 26.0% |
| Some College | 22.0% | 19.0% | 19.0% |
| Associate's Degree | 6.0% | 9.0% | 9.0% |
| Bachelor's Degree | 13.0% | 19.0% | 22.0% |
| Master's Degree | 9.0% | 9.0% | 10.0% |
| Professional Degree | 0.0% | 2.0% | 2.0% |
| Doctorate Degree | 0.0% | 1.0% | 2.0% |
Household Income For Brookville, Ohio
See the full breakdown
1.9% of households in Brookville earn Less than $10,000.
3.9% of households in Brookville earn $10,000 to $14,999.
8.4% of households in Brookville earn $15,000 to $24,999.
9.8% of households in Brookville earn $25,000 to $34,999.
14.9% of households in Brookville earn $35,000 to $49,999.
21.7% of households in Brookville earn $50,000 to $74,999.
10.9% of households in Brookville earn $75,000 to $99,999.
16.6% of households in Brookville earn $100,000 to $149,999.
5.9% of households in Brookville earn $150,000 to $199,999.
6.0% of households in Brookville earn $200,000 or more.
| Income | Brookville | OH | USA |
|---|---|---|---|
| Less than $10,000 | 1.9% | 5.2% | 5.0% |
| $10,000 to $14,999 | 3.9% | 4.0% | 3.4% |
| $15,000 to $24,999 | 8.4% | 7.1% | 6.3% |
| $25,000 to $34,999 | 9.8% | 7.5% | 6.6% |
| $35,000 to $49,999 | 14.9% | 11.6% | 10.1% |
| $50,000 to $74,999 | 21.7% | 16.9% | 15.5% |
| $75,000 to $99,999 | 10.9% | 13.1% | 12.6% |
| $100,000 to $149,999 | 16.6% | 17.1% | 17.5% |
| $150,000 to $199,999 | 5.9% | 8.3% | 9.6% |
| $200,000 or more | 6.0% | 9.1% | 13.4% |
Source: U.S. Census ACS 5-year estimates (2024)


