Duryea SnackAbility
Overall SnackAbility
Duryea, PA Weather
The average high in Duryea is 60.1° and the average low is 40.6°.
There are 78.0 days of precipitation each year.
Expect an average of 37.8 inches of precipitation each year with 45.1 inches of snow.
| Stat | Duryea |
|---|---|
| Average Annual High | 60.1 |
| Average Annual Low | 40.6 |
| Annual Precipitation Days | 78.0 |
| Average Annual Precipitation | 37.8 |
| Average Annual Snowfall | 45.1 |
Average High
Days of Rain
Source: NOAA climate normals (30-year)
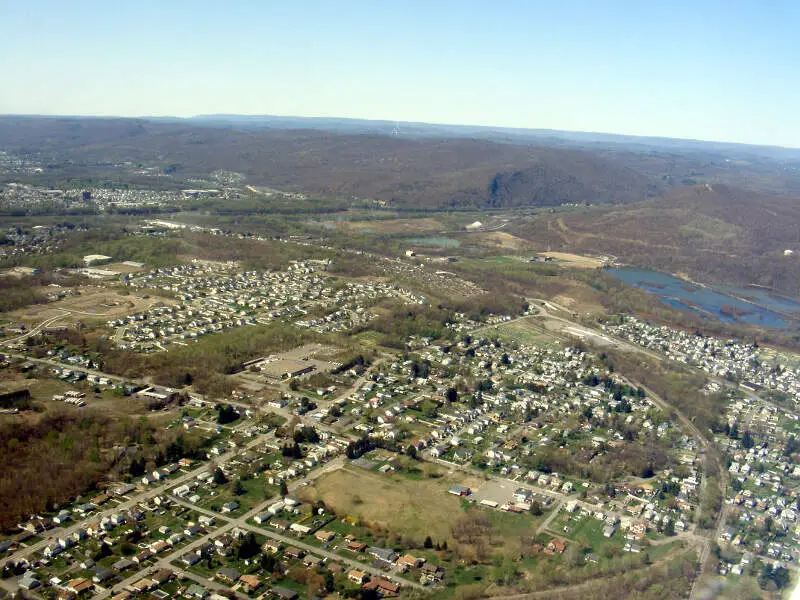
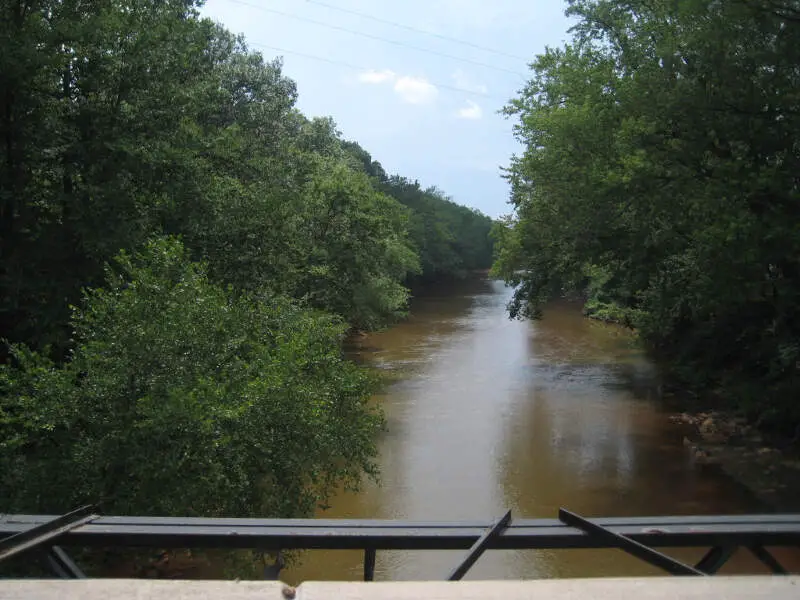
Duryea, PA Photos
Rankings & Articles For Duryea


Locations Around Duryea
Map Of Duryea, PA
Best Places Around Duryea
Clarks Summit, PA
Population 5,073
Mountain Top, PA
Population 11,850
Old Forge, PA
Population 8,573
Kingston, PA
Population 13,397
Blakely, PA
Population 6,662
Olyphant, PA
Population 5,381
Dunmore, PA
Population 14,181
Dickson, TN
Population 16,424
Swoyersville, PA
Population 5,048
Taylor, PA
Population 6,265
Duryea Demographics And Statistics
Population over time in Duryea
The current population in Duryea is 5,084. The population has increased 5.0% from 2010.
| Year | Population | % Change |
|---|---|---|
| 2024 | 5,084 | 0.6% |
| 2023 | 5,054 | 0.1% |
| 2022 | 5,047 | 0.5% |
| 2021 | 5,022 | 1.9% |
| 2020 | 4,926 | 1.3% |
| 2019 | 4,863 | -0.2% |
| 2018 | 4,875 | -0.2% |
| 2017 | 4,886 | -0.1% |
| 2016 | 4,889 | -0.9% |
| 2015 | 4,935 | 0.3% |
| 2014 | 4,918 | -0.0% |
| 2013 | 4,920 | 0.2% |
| 2012 | 4,911 | 0.4% |
| 2011 | 4,892 | 1.0% |
| 2010 | 4,844 | - |
Race / Ethnicity in Duryea
See the full breakdown
Duryea is:
77.5% White with 3,941 White residents.
0.1% African American with 5 African American residents.
0.0% American Indian with 0 American Indian residents.
1.4% Asian with 72 Asian residents.
0.0% Hawaiian with 0 Hawaiian residents.
0.0% Other with 0 Other residents.
1.0% Two Or More with 52 Two Or More residents.
19.9% Hispanic with 1,014 Hispanic residents.
| Race | Duryea | PA | USA |
|---|---|---|---|
| White | 77.5% | 73.0% | 57.4% |
| African American | 0.1% | 10.3% | 11.9% |
| American Indian | 0.0% | 0.1% | 0.5% |
| Asian | 1.4% | 3.8% | 5.9% |
| Hawaiian | 0.0% | 0.0% | 0.2% |
| Other | 0.0% | 0.5% | 0.6% |
| Two Or More | 1.0% | 3.6% | 4.3% |
| Hispanic | 19.9% | 8.7% | 19.3% |
Gender in Duryea
See the full breakdown
Duryea is 46.1% female with 2,341 female residents.
Duryea is 53.9% male with 2,742 male residents.
| Gender | Duryea | PA | USA |
|---|---|---|---|
| Female | 46.1% | 50.7% | 50.5% |
| Male | 53.9% | 49.3% | 49.5% |
Highest level of educational attainment in Duryea for adults over 25
See the full breakdown
1.0% of adults in Duryea completed < 9th grade.
8.0% of adults in Duryea completed 9-12th grade.
34.0% of adults in Duryea completed high school / ged.
24.0% of adults in Duryea completed some college.
10.0% of adults in Duryea completed associate's degree.
15.0% of adults in Duryea completed bachelor's degree.
6.0% of adults in Duryea completed master's degree.
0.0% of adults in Duryea completed professional degree.
2.0% of adults in Duryea completed doctorate degree.
| Education | Duryea | PA | USA |
|---|---|---|---|
| < 9th Grade | 1.0% | 3.0% | 4.0% |
| 9-12th Grade | 8.0% | 5.0% | 6.0% |
| High School / GED | 34.0% | 33.0% | 26.0% |
| Some College | 24.0% | 15.0% | 19.0% |
| Associate's Degree | 10.0% | 9.0% | 9.0% |
| Bachelor's Degree | 15.0% | 21.0% | 22.0% |
| Master's Degree | 6.0% | 10.0% | 10.0% |
| Professional Degree | 0.0% | 2.0% | 2.0% |
| Doctorate Degree | 2.0% | 2.0% | 2.0% |
Household Income For Duryea, Pennsylvania
See the full breakdown
4.8% of households in Duryea earn Less than $10,000.
3.8% of households in Duryea earn $10,000 to $14,999.
4.8% of households in Duryea earn $15,000 to $24,999.
14.8% of households in Duryea earn $25,000 to $34,999.
10.2% of households in Duryea earn $35,000 to $49,999.
17.1% of households in Duryea earn $50,000 to $74,999.
13.0% of households in Duryea earn $75,000 to $99,999.
20.6% of households in Duryea earn $100,000 to $149,999.
5.3% of households in Duryea earn $150,000 to $199,999.
5.5% of households in Duryea earn $200,000 or more.
| Income | Duryea | PA | USA |
|---|---|---|---|
| Less than $10,000 | 4.8% | 4.9% | 5.0% |
| $10,000 to $14,999 | 3.8% | 3.5% | 3.4% |
| $15,000 to $24,999 | 4.8% | 6.7% | 6.3% |
| $25,000 to $34,999 | 14.8% | 6.9% | 6.6% |
| $35,000 to $49,999 | 10.2% | 10.5% | 10.1% |
| $50,000 to $74,999 | 17.1% | 15.9% | 15.5% |
| $75,000 to $99,999 | 13.0% | 12.8% | 12.6% |
| $100,000 to $149,999 | 20.6% | 17.7% | 17.5% |
| $150,000 to $199,999 | 5.3% | 9.3% | 9.6% |
| $200,000 or more | 5.5% | 11.8% | 13.4% |
Source: U.S. Census ACS 5-year estimates (2024)


