
You’re probably never going to make enough money to live in the richest counties in Kentucky.
The median household income in Oldham County, the richest county in Kentucky is $122,497, significantly higher than the US median of $74,580, which means based purely on math most people never make enough to live there.
And that’s okay because it’s still fun to look at the people living in the lap of luxury.
So we used Saturday Night Science and the most recent Census to rank home prices and incomes for all 120 counties in the Bluegrass State. Let’s star gaze together.
Table Of Contents: Top Ten | Methodology | Table | Summary
The 10 Richest Counties In Kentucky For 2026
What is the richest county in Kentucky? The richest county in Kentucky is Oldham County. In contrast, the poorest county in state is Bell County, according to the Census data.
Now you know exactly where to move in Kentucky. Keep on reading for more about the top ten and a detailed methodology.
Or, check out the best places to live in Kentucky and the cheapest places to live in Kentucky.
The Richest Counties In Kentucky For 2026
1. Oldham County
Biggest Place: La Grange
Population: 69,257
Median Income: $122,497 (highest)
Median Home Price: $441,311 (highest)
More on Oldham County: Data
2. Spencer County
Biggest Place: Elk Creek
Population: 20,193
Median Income: $102,618 (2nd highest)
Median Home Price: $369,356 (2nd highest)
More on Spencer County: Data
3. Boone County
Biggest Place: Florence
Population: 139,841
Median Income: $99,414 (3rd highest)
Median Home Price: $342,671 (4th highest)
More on Boone County: Data
4. Woodford County
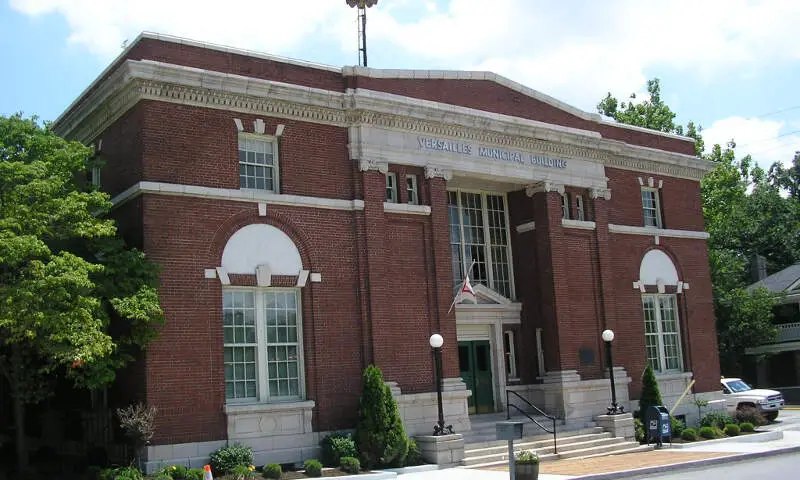
Biggest Place: Versailles
Population: 27,279
Median Income: $83,788 (5th highest)
Median Home Price: $343,458 (3rd highest)
More on Woodford County: Data
5. Scott County
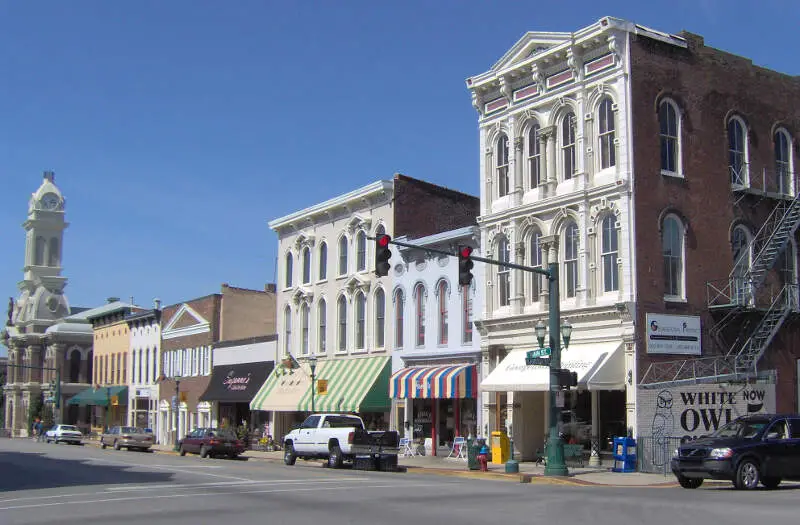
Biggest Place: Georgetown
Population: 59,536
Median Income: $85,158 (4th highest)
Median Home Price: $338,690 (5th highest)
More on Scott County: Data
6. Shelby County
Biggest Place: Shelbyville
Population: 49,096
Median Income: $82,604 (6th highest)
Median Home Price: $323,518 (7th highest)
More on Shelby County: Data
7. Bullitt County
Biggest Place: Mount Washington
Population: 84,027
Median Income: $80,558 (7th highest)
Median Home Price: $295,710 (9th highest)
More on Bullitt County: Data
8. Jessamine County
Biggest Place: Nicholasville
Population: 54,588
Median Income: $74,576 (10th highest)
Median Home Price: $320,970 (8th highest)
More on Jessamine County: Data
9. Campbell County
Biggest Place: Fort Thomas
Population: 93,426
Median Income: $77,567 (9th highest)
Median Home Price: $291,569 (12th highest)
More on Campbell County: Data
10. Fayette County
Biggest Place: Lexington-Fayette urban county
Population: 323,725
Median Income: $69,479 (15th highest)
Median Home Price: $328,842 (6th highest)
More on Fayette County: Data
Methodology: How do you determine which Kentucky county is the richest?
To determine the richest county in Kentucky, we have to look at a handful of metrics that correlate with how rich people are. To do that, we made assumptions about what makes a county rich. For reference, we are trying to make the kind of argument you’d make at a bar using facts, Saturday Night Science.
With that in mind, we went to the American Community Survey data and Zillow for the most recent reporting period for data on the following:
- Average Home Price
- Median Income
We then ranked each county in Kentucky for each of the criteria from one to 120, with one being the richest.
Taking the average rank across the two criteria, we created a Rich Score with the county posting the lowest overall score being the “Richest County In Kentucky.”
The result is some of the places with the most expensive real estate and highest earners in the Bluegrass State.
We updated this article for 2026. This report is our first time ranking the richest counties to live in Kentucky. We have also ranked the richest states and richest cities in the United States.
Summary: The Richest Counties In Kentucky For 2026
Living in Kentucky can vary from one part of the state to the next, with pretty extreme variance in home prices and incomes across counties.
The richest counties in Kentucky are Oldham County, Spencer County, Boone County, Woodford County, Scott County, Shelby County, Bullitt County, Jessamine County, Campbell County, and Fayette County.
Now you know the parts of the state where Goodwill will have the best goodies, and that’s what you came here to learn at the end of the day.
You are welcome.
Here’s a look at the poorest counties in Kentucky according to the data:
- Bell County
- Leslie County
- Breathitt County
For more Kentucky reading, check out:
- Safest Places In Kentucky
- Richest Cities In Kentucky
- Best Places To Live In Kentucky
- Best Counties To Live In Kentucky
Detailed List Of The Richest Counties In Kentucky
| Rank | County | Population | Median Income | Average Home Price |
|---|---|---|---|---|
| 1 | Oldham County | 69,257 | $122,497 | $441,311 |
| 2 | Spencer County | 20,193 | $102,618 | $369,356 |
| 3 | Boone County | 139,841 | $99,414 | $342,671 |
| 4 | Woodford County | 27,279 | $83,788 | $343,458 |
| 5 | Scott County | 59,536 | $85,158 | $338,690 |
| 6 | Shelby County | 49,096 | $82,604 | $323,518 |
| 7 | Bullitt County | 84,027 | $80,558 | $295,710 |
| 8 | Jessamine County | 54,588 | $74,576 | $320,970 |
| 9 | Campbell County | 93,426 | $77,567 | $291,569 |
| 10 | Fayette County | 323,725 | $69,479 | $328,842 |
| 11 | Kenton County | 171,288 | $80,548 | $282,910 |
| 12 | Meade County | 30,158 | $74,355 | $282,334 |
| 13 | Grant County | 25,418 | $69,178 | $283,036 |
| 14 | Jefferson County | 783,022 | $69,866 | $264,190 |
| 15 | Anderson County | 24,353 | $74,488 | $256,239 |
| 16 | Nelson County | 47,606 | $69,562 | $266,250 |
| 17 | Warren County | 140,918 | $65,794 | $294,046 |
| 18 | Hardin County | 111,942 | $67,647 | $245,406 |
| 19 | Garrard County | 17,568 | $63,087 | $291,730 |
| 20 | Madison County | 95,769 | $63,351 | $281,530 |
| 21 | Harrison County | 19,140 | $66,442 | $235,480 |
| 22 | Clark County | 37,192 | $64,348 | $259,293 |
| 23 | Larue County | 15,107 | $67,067 | $221,880 |
| 24 | Trimble County | 8,550 | $66,027 | $237,023 |
| 25 | Daviess County | 103,648 | $68,214 | $215,146 |
| 26 | Franklin County | 51,842 | $65,298 | $239,679 |
| 27 | Henry County | 15,856 | $63,347 | $250,391 |
| 28 | Pendleton County | 14,723 | $64,669 | $239,967 |
| 29 | Mercer County | 23,028 | $64,824 | $238,830 |
| 30 | Washington County | 12,140 | $61,616 | $250,388 |
| 31 | Bourbon County | 20,240 | $61,354 | $248,557 |
| 32 | Bracken County | 8,444 | $66,319 | $202,626 |
| 33 | Boyle County | 30,941 | $61,159 | $241,154 |
| 34 | Hancock County | 9,034 | $65,464 | $203,526 |
| 35 | Marshall County | 31,743 | $65,831 | $200,096 |
| 36 | Simpson County | 19,972 | $59,858 | $253,149 |
| 37 | Gallatin County | 8,769 | $63,346 | $211,483 |
| 38 | Allen County | 21,293 | $61,403 | $209,421 |
| 39 | Todd County | 12,469 | $61,103 | $221,369 |
| 40 | Mccracken County | 67,564 | $64,373 | $193,181 |
| 41 | Marion County | 19,749 | $59,627 | $235,196 |
| 42 | Lyon County | 8,900 | $65,066 | $177,158 |
| 43 | Taylor County | 26,397 | $60,456 | $207,412 |
| 44 | Montgomery County | 28,395 | $56,396 | $226,506 |
| 45 | Logan County | 27,986 | $60,382 | $194,783 |
| 46 | Mclean County | 9,114 | $65,596 | $153,568 |
| 47 | Owen County | 11,330 | $61,134 | $174,605 |
| 48 | Henderson County | 44,280 | $58,851 | $200,774 |
| 49 | Nicholas County | 7,708 | $59,531 | $199,883 |
| 50 | Christian County | 72,069 | $55,494 | $205,858 |
| 51 | Carroll County | 10,954 | $56,466 | $190,250 |
| 52 | Laurel County | 62,983 | $57,771 | $180,308 |
| 53 | Edmonson County | 12,355 | $54,937 | $191,973 |
| 54 | Butler County | 12,393 | $56,092 | $187,635 |
| 55 | Ballard County | 7,654 | $66,164 | $130,038 |
| 56 | Robertson County | 2,283 | $51,830 | $204,773 |
| 57 | Barren County | 44,938 | $50,628 | $212,440 |
| 58 | Bath County | 12,851 | $56,541 | $173,428 |
| 59 | Rowan County | 24,578 | $54,321 | $179,763 |
| 60 | Greenup County | 35,501 | $60,751 | $151,274 |
| 61 | Lincoln County | 24,504 | $52,440 | $180,736 |
| 62 | Hart County | 19,603 | $52,285 | $185,516 |
| 63 | Carlisle County | 4,762 | $62,439 | $136,907 |
| 64 | Breckinridge County | 20,881 | $55,843 | $166,094 |
| 65 | Adair County | 19,089 | $53,553 | $170,019 |
| 66 | Pulaski County | 65,897 | $51,898 | $172,252 |
| 67 | Caldwell County | 12,618 | $59,583 | $148,728 |
| 68 | Boyd County | 47,911 | $61,118 | $130,494 |
| 69 | Green County | 11,369 | $46,798 | $188,888 |
| 70 | Calloway County | 38,224 | $52,706 | $165,373 |
| 71 | Mason County | 16,956 | $52,178 | $166,855 |
| 72 | Metcalfe County | 10,425 | $51,473 | $170,421 |
| 73 | Webster County | 12,842 | $59,628 | $144,024 |
| 74 | Fleming County | 15,323 | $49,307 | $178,560 |
| 75 | Ohio County | 23,735 | $57,798 | $148,738 |
| 76 | Hopkins County | 45,119 | $56,815 | $149,498 |
| 77 | Trigg County | 14,315 | $59,857 | $143,558 |
| 78 | Livingston County | 8,903 | $58,984 | $144,381 |
| 79 | Union County | 13,260 | $60,327 | $133,740 |
| 80 | Graves County | 36,630 | $50,772 | $167,100 |
| 81 | Hickman County | 4,439 | $60,867 | $122,762 |
| 82 | Carter County | 26,341 | $51,235 | $159,696 |
| 83 | Grayson County | 26,707 | $50,757 | $163,925 |
| 84 | Wolfe County | 6,443 | $30,417 | $221,388 |
| 85 | Wayne County | 19,602 | $45,739 | $167,850 |
| 86 | Elliott County | 7,307 | $45,776 | $157,150 |
| 87 | Lawrence County | 16,077 | $46,772 | $152,920 |
| 88 | Monroe County | 11,269 | $51,280 | $144,850 |
| 89 | Clinton County | 9,202 | $44,844 | $157,825 |
| 90 | Casey County | 15,914 | $45,510 | $153,837 |
| 91 | Rockcastle County | 16,163 | $48,862 | $147,046 |
| 92 | Muhlenberg County | 30,591 | $51,927 | $127,979 |
| 93 | Russell County | 18,221 | $44,738 | $150,972 |
| 94 | Morgan County | 14,053 | $47,913 | $136,291 |
| 95 | Whitley County | 36,920 | $44,615 | $150,377 |
| 96 | Powell County | 13,038 | $40,309 | $152,340 |
| 97 | Johnson County | 22,334 | $44,904 | $141,663 |
| 98 | Estill County | 14,035 | $46,051 | $128,200 |
| 99 | Crittenden County | 8,979 | $46,656 | $126,163 |
| 100 | Knox County | 29,865 | $32,527 | $154,302 |