Do you live in one of the murder capitals of New Jersey?
We all watch the news with horror when we hear about a homicide that happens not that far away from us. While a murder just blocks or even a couple of towns away from your house would make anyone uneasy, in the long run, most likely, where you live is relatively safe.
To find the cities in New Jersey with the most murders and the highest murder rates per capita, we used Saturday Night Science to compare the FBI crime data on murders for the 64 cities in the Garden State with over 5,000 residents.
What city has the highest murder rate in New Jersey? The city with the highest murder rate in New Jersey is Camden County Police Department with 26 murders per 100,000 people.
What is the city in New Jersey with highest number of murders? The city in New Jersey with the highest number of murders is Newark with 39 murders.
Read on below to see how we crunched the numbers and how your town in New Jersey ranked. There were ‘only’ 64 cities in New Jersey where a city reported a murder to the FBI, meaning 265 places had no murder.
26 per 100k · #1 highest murder rate in New Jersey
23 per 100k · #2 highest murder rate in New Jersey
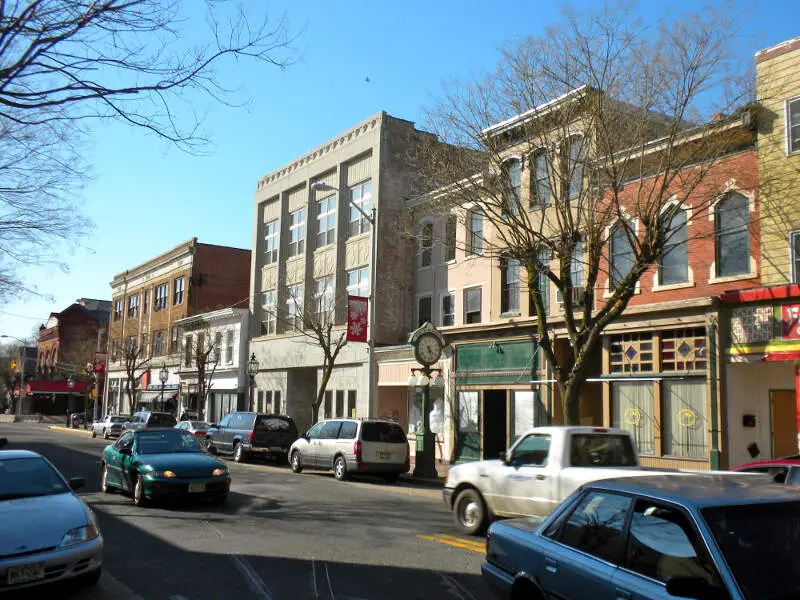
Bridgeton is a city in Cumberland County, New Jersey, United States, in the southern part of the state, on the Cohansey River, near Delaware Bay. As of the 2010 United States Census, the city’s population was 25,349, reflecting an increase of 2,578 from the 22,771 counted in the 2000 Census, which had in turn increased by 3,829 from the 18,942 counted in the 1990 Census. It is the county seat of Cumberland County. Bridgeton, Millville, and Vineland are the three principal cities of the Vineland-Millville-Bridgeton Primary Metropolitan Statistical Area, which encompasses those cities and all of Cumberland County for statistical purposes and which constitutes a part of the Delaware Valley.
Data | Crime | Cost of living | Movers
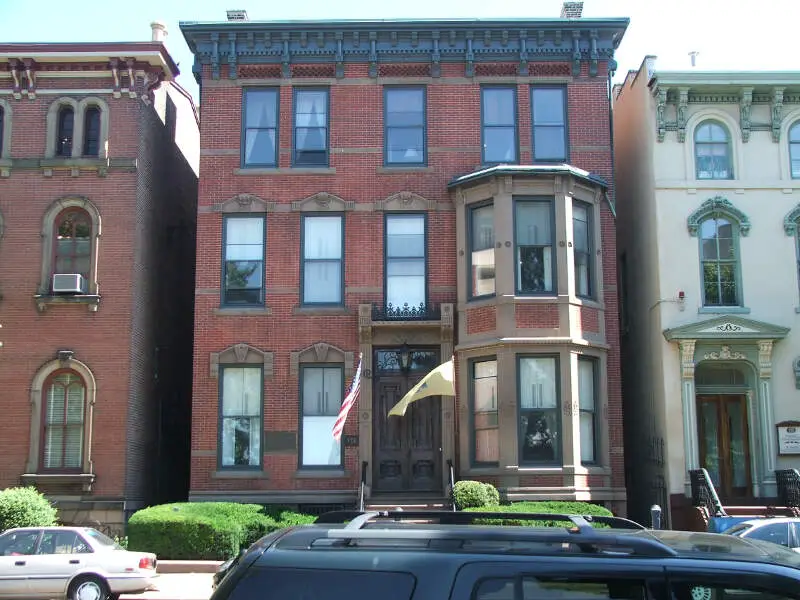
22 per 100k · #3 highest murder rate in New Jersey
Trenton is the capital city of the U.S. state of New Jersey and the county seat of Mercer County. It was briefly the capital of the United States. The city’s metropolitan area is grouped with the New York metropolitan area by the United States Census Bureau, but directly borders the Philadelphia metropolitan area and is part of the Federal Communications Commission’s Philadelphia Designated Market Area. As of the 2010 United States Census, Trenton had a population of 84,913, making it the state’s 10th-largest municipality. The Census Bureau estimated that the city’s population was 84,034 in 2014.
Data | Crime | Cost of living | Movers
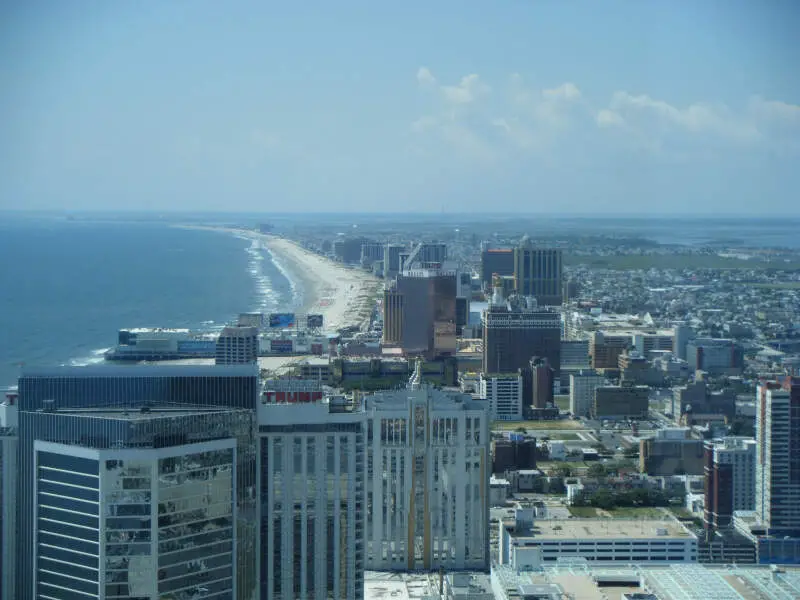
18 per 100k · #4 highest murder rate in New Jersey
Atlantic City is a resort city in Atlantic County, New Jersey, United States, known for its casinos, boardwalks, and beaches. In 2010, it had a population of 39,558. The city was incorporated on May 1, 1854, from portions of Egg Harbor Township and Galloway Township. It borders Absecon, Brigantine, Pleasantville, Ventnor City, West Atlantic City, and the Atlantic Ocean.
Data | Crime | Cost of living | Movers
18 per 100k · #5 highest murder rate in New Jersey
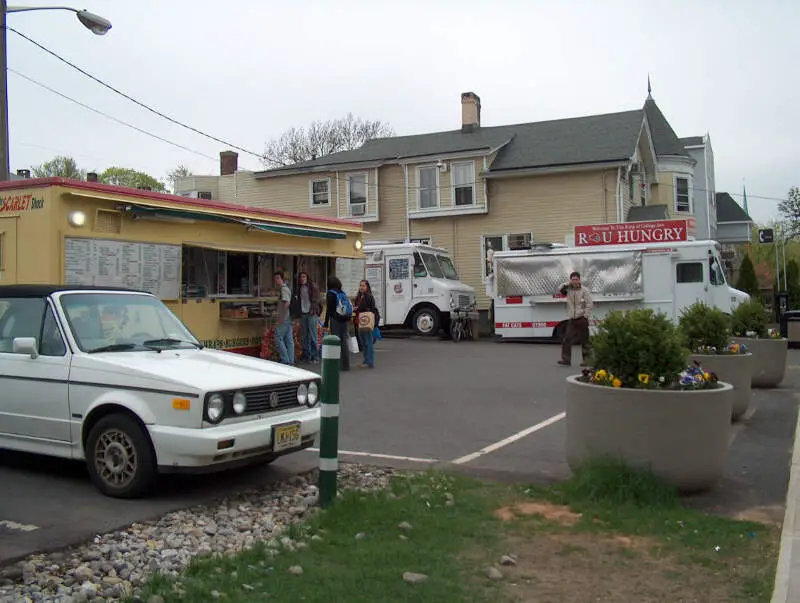
16 per 100k · #6 highest murder rate in New Jersey
New Brunswick is a city in Middlesex County, New Jersey, United States. It is the county seat of Middlesex County, and the home of Rutgers University. The city is on the Northeast Corridor rail line, 27 miles southwest of Manhattan, on the southern bank of the Raritan River. At the 2010 United States Census, the population of New Brunswick was 55,181, reflecting an increase of 6,608 from the 48,573 counted in the 2000 Census, which had in turn increased by 6,862 from the 41,711 counted in the 1990 Census. Due to the concentration of medical facilities in the area, including Robert Wood Johnson University Hospital and Saint Peter’s University Hospital, as well as Rutgers, The State University of New Jersey’s Robert Wood Johnson Medical School, New Brunswick is known as “the Hub City.” The corporate headquarters and production facilities of several global pharmaceutical companies are situated in the city, including Johnson & Johnson and Bristol-Myers Squibb.
Data | Crime | Cost of living | Movers
15 per 100k · #7 highest murder rate in New Jersey
15 per 100k · #8 highest murder rate in New Jersey
Millville is a city in Cumberland County, New Jersey, United States. As of the 2010 United States Census, the city’s population was 28,400, reflecting an increase of 1,553 from the 26,847 counted in the 2000 Census, which had in turn increased by 855 from the 25,992 counted in the 1990 Census. Millville, Bridgeton and Vineland are the three principal New Jersey cities of the Vineland-Millville-Bridgeton Primary Metropolitan Statistical Area which encompasses those cities and all of Cumberland County for statistical purposes.
Data | Crime | Cost of living | Movers
14 per 100k · #9 highest murder rate in New Jersey

14 per 100k · #10 highest murder rate in New Jersey
Data | Crime | Cost of living | Movers
The receipts
Compare the top ten
Pick a metric. The bars rescale. The red line is New Jersey’s statewide median.
On the map
Where New Jersey’s murders happen
Saturday Night Science
Methodology: How we calculated the murder capitals of New Jersey
While there are surveys and public polls on what cities in a state are the most dangerous, we wanted to rely on something other than speculation and opinion. Instead, we used Saturday Night Science to compare the hard numbers from the FBI’s last year of reporting. Specifically, we analyzed the FBI’s Uniform Crime Report, which summarizes the number of murders in each city annually.
We only looked at every single city in New Jersey for which FBI data was available for the most recent FBI Crime In The United States. That left us with 64 cities to rank.
We took the number of murders per capita as the ranking factor. The place with the most murders per capita based on the most recent data is Camden County Police Department. It is our eleventh time ranking the places with the most murders per capita in New Jersey. We updated the list for 2026.
The full plate
Murder Rates By City In New Jersey
Click any column to sort. Search by city name.
| Rank | City | Population | Murders | Murders/100K |
|---|---|---|---|---|
| 1 | Camden County Police Department | 72,435 | 19 | 26 |
| 2 | Bridgeton | 26,634 | 6 | 23 |
| 3 | Trenton | 91,236 | 20 | 22 |
| 4 | Atlantic City | 38,480 | 7 | 18 |
| 5 | Independence Township | 5,539 | 1 | 18 |
| 6 | New Brunswick | 57,259 | 9 | 16 |
| 7 | Eastampton Township | 6,524 | 1 | 15 |
| 8 | Millville | 27,340 | 4 | 15 |
| 9 | Ocean Township, Monmouth County | 27,835 | 4 | 14 |
| 10 | Keyport | 7,072 | 1 | 14 |
| 11 | Newark | 309,708 | 39 | 13 |
| 12 | Fairfield Township, Essex County | 8,150 | 1 | 12 |
| 13 | Runnemede | 8,528 | 1 | 12 |
| 14 | Clayton | 9,191 | 1 | 11 |
| 15 | Hamilton Township, Atlantic County | 28,528 | 3 | 11 |
| 16 | Willingboro Township | 32,211 | 3 | 9 |
| 17 | South Amboy | 10,781 | 1 | 9 |
| 18 | Pine Hill | 11,028 | 1 | 9 |
| 19 | Guttenberg | 11,426 | 1 | 9 |
| 20 | Irvington | 60,900 | 5 | 8 |
| 21 | Red Bank | 12,737 | 1 | 8 |
| 22 | Carteret | 25,827 | 2 | 8 |
| 23 | Paramus | 26,745 | 2 | 7 |
| 24 | East Orange | 71,138 | 5 | 7 |
| 25 | Somerville | 15,122 | 1 | 7 |
| 26 | Union Township | 62,290 | 4 | 6 |
| 27 | Mantua Township | 15,851 | 1 | 6 |
| 28 | Paterson | 158,903 | 10 | 6 |
| 29 | Franklin Township, Gloucester County | 16,963 | 1 | 6 |
| 30 | Orange City | 34,349 | 2 | 6 |
| 31 | Weehawken Township | 17,617 | 1 | 6 |
| 32 | Perth Amboy | 56,409 | 3 | 5 |
| 33 | Pleasantville | 20,619 | 1 | 5 |
| 34 | Hazlet Township | 20,663 | 1 | 5 |
| 35 | Teaneck Township | 42,771 | 2 | 5 |
| 36 | Moorestown Township | 21,647 | 1 | 5 |
| 37 | Lindenwold | 22,184 | 1 | 5 |
| 38 | Manchester Township | 47,488 | 2 | 4 |
| 39 | Glassboro | 24,793 | 1 | 4 |
| 40 | Raritan Township | 25,018 | 1 | 4 |
| 41 | Wall Township | 26,547 | 1 | 4 |
| 42 | Elizabeth | 138,500 | 5 | 4 |
| 43 | North Bergen Township | 59,532 | 2 | 3 |
| 44 | Vineland | 60,848 | 2 | 3 |
| 45 | Long Branch | 33,113 | 1 | 3 |
| 46 | Garfield | 33,129 | 1 | 3 |
| 47 | Gloucester Township | 67,786 | 2 | 3 |
| 48 | Ewing Township | 34,718 | 1 | 3 |
| 49 | Galloway Township | 37,910 | 1 | 3 |
| 50 | Marlboro Township | 41,344 | 1 | 2 |
| 51 | Jersey City | 297,922 | 7 | 2 |
| 52 | West Orange | 48,638 | 1 | 2 |
| 53 | Howell Township | 53,988 | 1 | 2 |
| 54 | Hoboken | 57,293 | 1 | 2 |
| 55 | Jackson Township | 62,326 | 1 | 2 |
| 56 | Middletown Township | 66,307 | 1 | 2 |
| 57 | Franklin Township, Somerset County | 69,921 | 1 | 1 |
| 58 | Passaic | 69,938 | 1 | 1 |
| 59 | Lakewood Township | 144,876 | 2 | 1 |
| 60 | Cherry Hill Township | 79,950 | 1 | 1 |
| 61 | Clifton | 89,870 | 1 | 1 |
| 62 | Hamilton Township, Mercer County | 93,487 | 1 | 1 |
| 63 | Toms River Township | 102,734 | 1 | 1 |
| 64 | Edison Township | 109,086 | 1 | 1 |
Source: FBI Uniform Crime Report. 64 New Jersey cities that reported a murder.
Summary
Summary: The Places With The Most Murders In New Jersey For 2026
If you’re looking at the places in New Jersey with the most murders, and where residents have the highest chances of being killed themselves, this is an accurate list. Again, these statistics are an indication of where crimes occur, not a statement about the effectiveness of the law enforcement in the areas they serve.
The cities with the highest murder per capita in New Jersey are Camden County Police Department, Bridgeton, Trenton, Atlantic City, Independence Township, New Brunswick, Eastampton Township, Millville, Ocean Township, Monmouth County, and Keyport. Not sold on New Jersey? Take the two-minute Find Your Place quiz and see which state actually fits you.
Questions and answers
Deadliest Cities In New Jersey FAQs
What city in New Jersey has the highest murder rate?
Camden County Police Department has the highest murder rate in New Jersey for 2026, at 26 murders per 100,000 residents. That is based on the latest FBI Uniform Crime Report data.
What is the murder capital of New Jersey?
Camden County Police Department is the murder capital of New Jersey on a per-capita basis. On raw numbers, Newark logged the most murders with 39.
How many cities in New Jersey reported no murders at all?
265 New Jersey cities reported zero murders to the FBI in the most recent reporting year. Only 64 cities reported at least one, and those are the ones in this ranking.
What are the deadliest cities in New Jersey?
The deadliest cities in New Jersey are Camden County Police Department, Bridgeton, Trenton, Atlantic City, Independence Township, New Brunswick, Eastampton Township, Millville, Ocean Township, Monmouth County, and Keyport, ranked by murders per capita. All of the numbers come from the FBI’s most recent Uniform Crime Report.
Why rank by murder rate instead of total murders?
Because population size swamps everything else. The biggest cities almost always log the most total murders, but a rate per 100,000 residents shows where the risk actually runs highest — which is why Camden County Police Department tops this list at 26 per 100k.


