Compare Paterson to…
Paterson SnackAbility
Overall SnackAbility
Crime in Paterson summary. We use data from the FBI to determine the crime rates in Paterson. Key points include:
There were 5,291 total crimes in Paterson in the last reporting year.
The overall crime rate per 100,000 people in Paterson is 3,329.7 / 100k people.
The violent crime rate per 100,000 people in Paterson is 978.6 / 100k people.
The property crime rate per 100,000 people in Paterson is 2,351.1 / 100k people.
Overall, crime in Paterson is 57.12% above the national average.
Total Crimes
Above National Average
Crime In Paterson Comparison Table
| Statistic | Count Raw |
Paterson / 100k People |
New Jersey / 100k People |
National / 100k People |
|---|---|---|---|---|
| Total Crimes Per 100K | 5,291 | 3,329.7 | 1,645.1 | 2,119.2 |
| Violent Crime | 1,555 | 978.6 | 217.7 | 359.0 |
| Murder | 10 | 6.3 | 2.3 | 5.0 |
| Robbery | 393 | 247.3 | 49.3 | 61.0 |
| Aggravated Assault | 1,093 | 687.8 | 148.8 | 256.0 |
| Property Crime | 3,736 | 2,351.1 | 1,427.3 | 1,760.0 |
| Burglary | 572 | 360.0 | 145.3 | 229.0 |
| Larceny | 2,353 | 1,480.8 | 1,119.4 | 1,272.0 |
| Car Theft | 811 | 510.4 | 162.6 | 259.0 |
Source: FBI Uniform Crime Reporting (2024)
Cost of living in Paterson summary. We use data on the cost of living to determine how expensive it is to live in Paterson. Real estate prices drive most of the variance in cost of living around New Jersey. Key points include:
The cost of living in Paterson is 121 with 100 being average.
The cost of living in Paterson is 1.2x higher than the national average.
The median home value in Paterson is $528,882.
The median income in Paterson is $55,997.
Paterson's Overall Cost Of Living
Higher Than The National Average
Cost Of Living In Paterson Comparison Table
| Living Expense | Paterson | New Jersey | National Average |
|---|---|---|---|
| Overall | 121 | 125 | 100 |
| Services | 108 | 107 | 100 |
| Groceries | 112 | 113 | 100 |
| Health | 138 | 155 | 100 |
| Housing | 120 | 116 | 100 |
| Transportation | 111 | 112 | 100 |
| Utilities | 112 | 113 | 100 |
Source: Cost of living index, normalized to US average = 100
Paterson, NJ Weather
The average high in Paterson is 62.8° and the average low is 43.5°.
There are 77.7 days of precipitation each year.
Expect an average of 50.4 inches of precipitation each year with 24.9 inches of snow.
| Stat | Paterson |
|---|---|
| Average Annual High | 62.8 |
| Average Annual Low | 43.5 |
| Annual Precipitation Days | 77.7 |
| Average Annual Precipitation | 50.4 |
| Average Annual Snowfall | 24.9 |
Average High
Days of Rain
Source: NOAA climate normals (30-year)
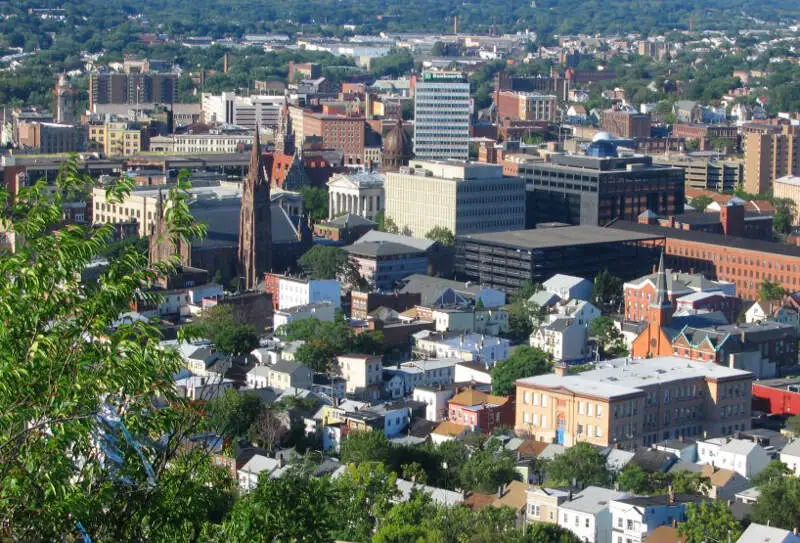
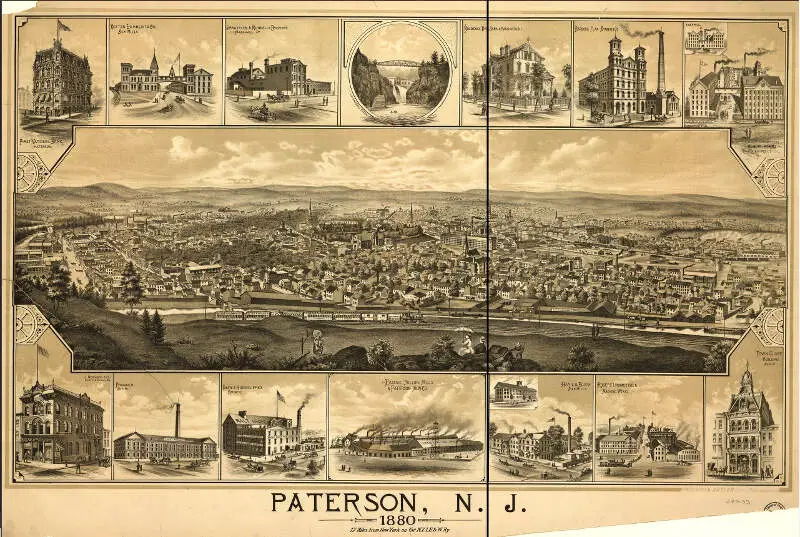
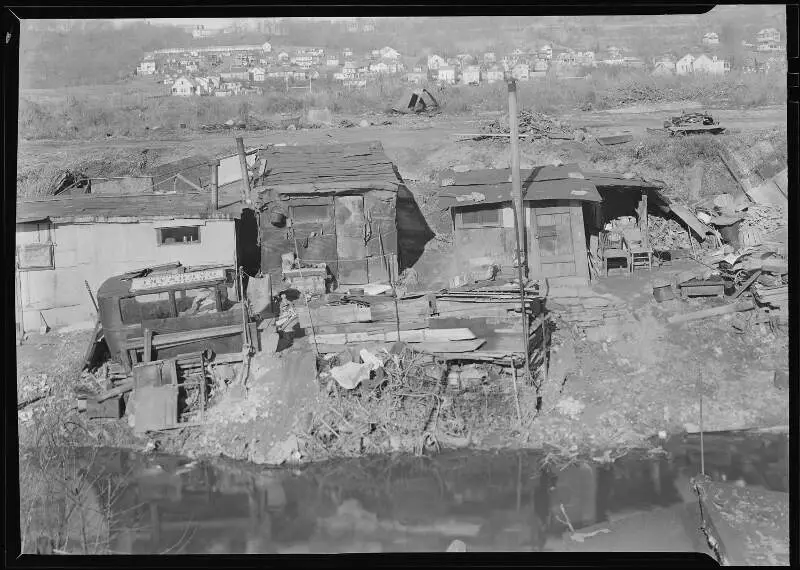
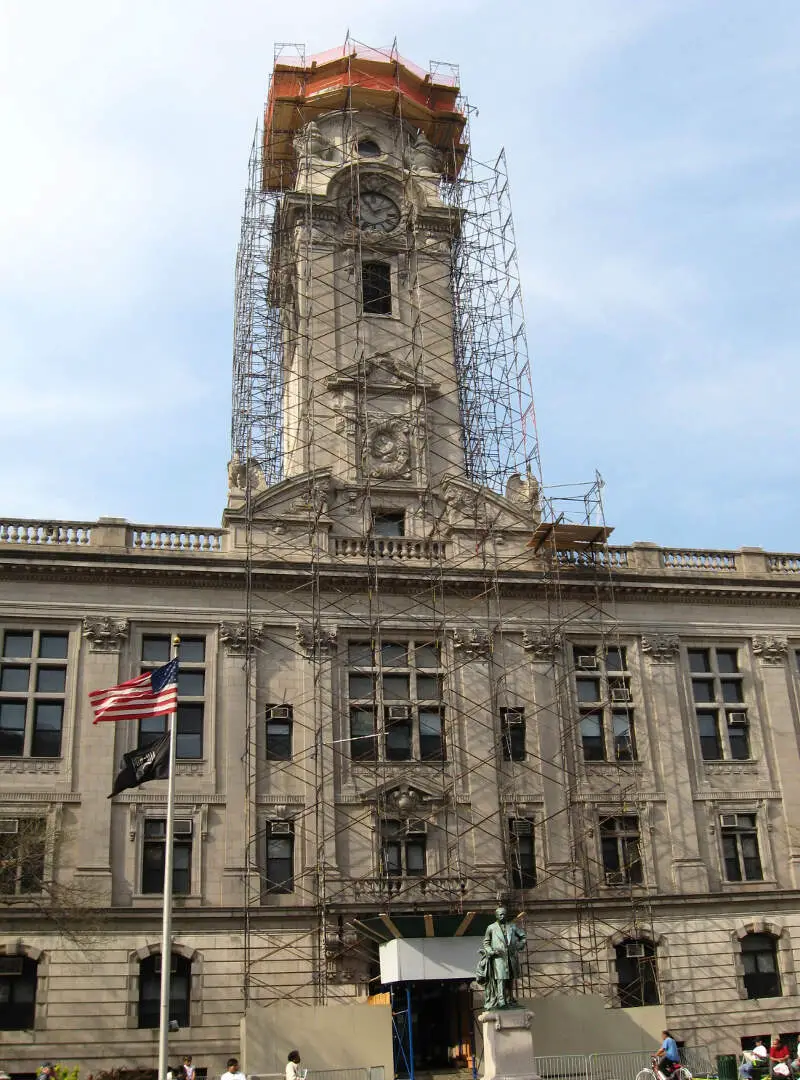
Paterson, NJ Photos
2 Reviews & Comments About Paterson

I would like to one day visit Patterson as I am a fan of Lou Costello, and this is his hometown. But hearing it has a lots of gangs, I might decline.
Lots of crime but I'm a thug so I'm eating good
Every night at about 2:30ish someone knocks at my door but every time I get to the door the person runs away
Rankings & Articles For Paterson


Locations Around Paterson
Map Of Paterson, NJ
Best Places Around Paterson
Bronxville, NY
Population 6,510
Pelham Manor, NY
Population 5,644
Tappan, NY
Population 6,687
Irvington, NY
Population 6,531
Blauvelt, NY
Population 5,406
Eastchester, NY
Population 20,491
Dobbs Ferry, NY
Population 11,443
Congers, NY
Population 8,275
Hillcrest, NY
Population 9,071
Hastings-on-Hudson, NY
Population 8,434
Paterson Demographics And Statistics
Population over time in Paterson
The current population in Paterson is 158,735. The population has increased 8.8% from 2010.
| Year | Population | % Change |
|---|---|---|
| 2024 | 158,735 | 0.7% |
| 2023 | 157,660 | -0.1% |
| 2022 | 157,864 | -0.0% |
| 2021 | 157,927 | 8.6% |
| 2020 | 145,484 | -0.2% |
| 2019 | 145,710 | -0.1% |
| 2018 | 145,800 | -1.4% |
| 2017 | 147,890 | 0.7% |
| 2016 | 146,894 | -0.1% |
| 2015 | 146,987 | 0.4% |
| 2014 | 146,341 | 0.3% |
| 2013 | 145,920 | 0.2% |
| 2012 | 145,655 | -0.2% |
| 2011 | 145,915 | 0.1% |
| 2010 | 145,836 | - |
Race / Ethnicity in Paterson
See the full breakdown
Paterson is:
7.8% White with 12,454 White residents.
22.1% African American with 35,041 African American residents.
0.0% American Indian with 4 American Indian residents.
4.1% Asian with 6,515 Asian residents.
0.0% Hawaiian with 36 Hawaiian residents.
0.6% Other with 954 Other residents.
0.8% Two Or More with 1,295 Two Or More residents.
64.5% Hispanic with 102,436 Hispanic residents.
| Race | Paterson | NJ | USA |
|---|---|---|---|
| White | 7.8% | 50.9% | 57.4% |
| African American | 22.1% | 12.2% | 11.9% |
| American Indian | 0.0% | 0.1% | 0.5% |
| Asian | 4.1% | 10.0% | 5.9% |
| Hawaiian | 0.0% | 0.0% | 0.2% |
| Other | 0.6% | 0.8% | 0.6% |
| Two Or More | 0.8% | 3.5% | 4.3% |
| Hispanic | 64.5% | 22.5% | 19.3% |
Gender in Paterson
See the full breakdown
Paterson is 50.8% female with 80,591 female residents.
Paterson is 49.2% male with 78,143 male residents.
| Gender | Paterson | NJ | USA |
|---|---|---|---|
| Female | 50.8% | 50.8% | 50.5% |
| Male | 49.2% | 49.2% | 49.5% |
Highest level of educational attainment in Paterson for adults over 25
See the full breakdown
15.0% of adults in Paterson completed < 9th grade.
11.0% of adults in Paterson completed 9-12th grade.
41.0% of adults in Paterson completed high school / ged.
17.0% of adults in Paterson completed some college.
5.0% of adults in Paterson completed associate's degree.
9.0% of adults in Paterson completed bachelor's degree.
2.0% of adults in Paterson completed master's degree.
0.0% of adults in Paterson completed professional degree.
0.0% of adults in Paterson completed doctorate degree.
| Education | Paterson | NJ | USA |
|---|---|---|---|
| < 9th Grade | 15.0% | 4.0% | 4.0% |
| 9-12th Grade | 11.0% | 5.0% | 6.0% |
| High School / GED | 41.0% | 25.0% | 26.0% |
| Some College | 17.0% | 15.0% | 19.0% |
| Associate's Degree | 5.0% | 7.0% | 9.0% |
| Bachelor's Degree | 9.0% | 26.0% | 22.0% |
| Master's Degree | 2.0% | 13.0% | 10.0% |
| Professional Degree | 0.0% | 3.0% | 2.0% |
| Doctorate Degree | 0.0% | 2.0% | 2.0% |
Household Income For Paterson, New Jersey
See the full breakdown
8.2% of households in Paterson earn Less than $10,000.
6.9% of households in Paterson earn $10,000 to $14,999.
9.2% of households in Paterson earn $15,000 to $24,999.
8.3% of households in Paterson earn $25,000 to $34,999.
12.9% of households in Paterson earn $35,000 to $49,999.
15.9% of households in Paterson earn $50,000 to $74,999.
13.2% of households in Paterson earn $75,000 to $99,999.
13.4% of households in Paterson earn $100,000 to $149,999.
6.4% of households in Paterson earn $150,000 to $199,999.
5.6% of households in Paterson earn $200,000 or more.
| Income | Paterson | NJ | USA |
|---|---|---|---|
| Less than $10,000 | 8.2% | 4.1% | 5.0% |
| $10,000 to $14,999 | 6.9% | 2.7% | 3.4% |
| $15,000 to $24,999 | 9.2% | 4.8% | 6.3% |
| $25,000 to $34,999 | 8.3% | 5.1% | 6.6% |
| $35,000 to $49,999 | 12.9% | 7.6% | 10.1% |
| $50,000 to $74,999 | 15.9% | 12.8% | 15.5% |
| $75,000 to $99,999 | 13.2% | 11.3% | 12.6% |
| $100,000 to $149,999 | 13.4% | 18.1% | 17.5% |
| $150,000 to $199,999 | 6.4% | 11.8% | 9.6% |
| $200,000 or more | 5.6% | 21.6% | 13.4% |
Source: U.S. Census ACS 5-year estimates (2024)


