Chicago has close to 450 murders a year, so you should probably look at RoadSnacks’ list of the worst neighborhoods in Chi-town for 2025 before you make any life changing decisions.
But first, how did we create our list? In order to determine Chicago’s worst neighborhoods, we had to give each neighborhood an actual concrete score: we call this a neighborhood’s overall ‘Snackability’. To get this score, we looked at the latest census data on income levels, unemployment rates, crime, and home prices for 77 Chicago neighborhoods with over 0 residents.
As you can imagine, Chicago’s worst neighborhoods did not have very good scores. Folks, the kind of neighborhoods we’re talking about have carjackings happening in broad daylight, daily robberies, and a bunch of nothing good happens after dark crimes. There are currently 13,500 police officers that patrol Chicago, but the city houses 3 million residents. Law enforcement is doing their best to clean up the city’s worst neighborhoods, but they can’t be everywhere. And, if you guessed that most of Chicago’s worst neighborhoods are South of the city, you guessed right. Sadly, Chicago’s South Side is probably the reason the city as a whole is one of the most dangerous cities in the country.
We’re not saying that Chicago is all bad. Matter of fact, there’s actually a lot of safe fun to be had in a lot of pretty awesome neighborhoods. For instance, North Center really brings their A-game with their Holiday Delight every year and you definitely shouldn’t miss Logan Square’s Art’s Festival. But, we’re here to talk about Chicago’s worst.
So, want to know what Chicago neighborhoods you should avoid if you value your life? Keep reading.
Table Of Contents: Top 10 | Methodology | Summary | Table
This is our tenth time ranking Chicago’s worst neighborhoods, so trust us when we say that these neighborhoods are “no bueno”!. The Monsters of the Midway wouldn’t even feel safe in these places.
So, what’s the worst neighborhood in Chicago for 2025? The worst neighborhood in Chicago based on the data would be Riverdale.
If you want to know where the where the rest of Chicago’s worst neighborhoods are located, take a look below; and If you don’t see what you’re looking for there, head to the bottom.
For more Illinois reading, check out:
- Best Places To Live In Illinois
- Cheapest Places To Live In Illinois
- Most Dangerous Cities In Illinois
The 10 Most Dangerous Neighborhoods In Chicago For 2025
/10
Population: 165
Violent Crimes Per 100k: 971
Property Crime Per 100k: 5,491
Median Home Value: $85,600 (worst)
Median Income: $19,067 (worst)
More on Riverdale: Data
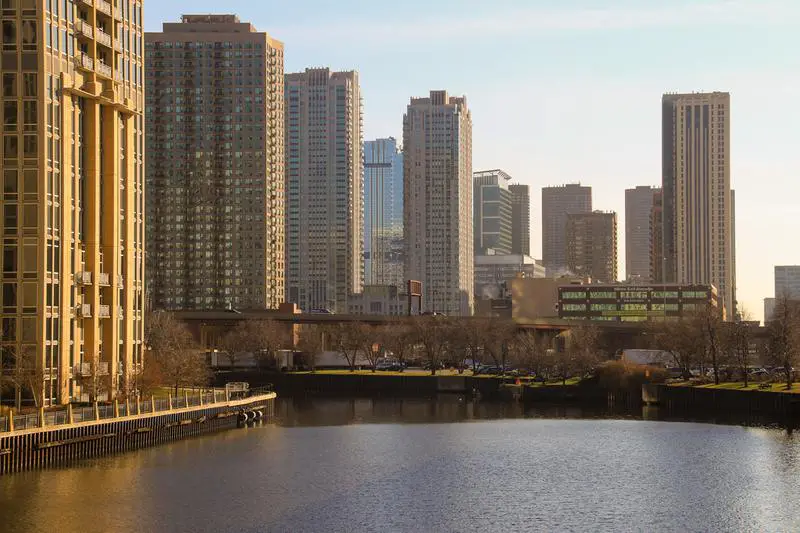
Welcome to Riverdale, the most dangerous neighborhood in Chicago. This little nook of the windy city is about halfway between downtown and Chicago heights, along I-94. If you find yourself lost, don’t get off on E. 130th Street. That’s Riverdale. That’s bad.
This is what it’s like in Riverdale after dark. About 1 in 4 residents here doesn’t work and entire families make an absurdly low $14,000 a year. Riverdale kinda resembles a third world country in some blocks.
Can we interest anyone in a $85,600 house in Riverdale? No? Okay then
/10
Population: 5,403
Violent Crimes Per 100k: 2,062
Property Crime Per 100k: 9,816
Median Home Value: $102,086 (2nd worst)
Median Income: $31,584 (8th worst)
More on South Deering: Data
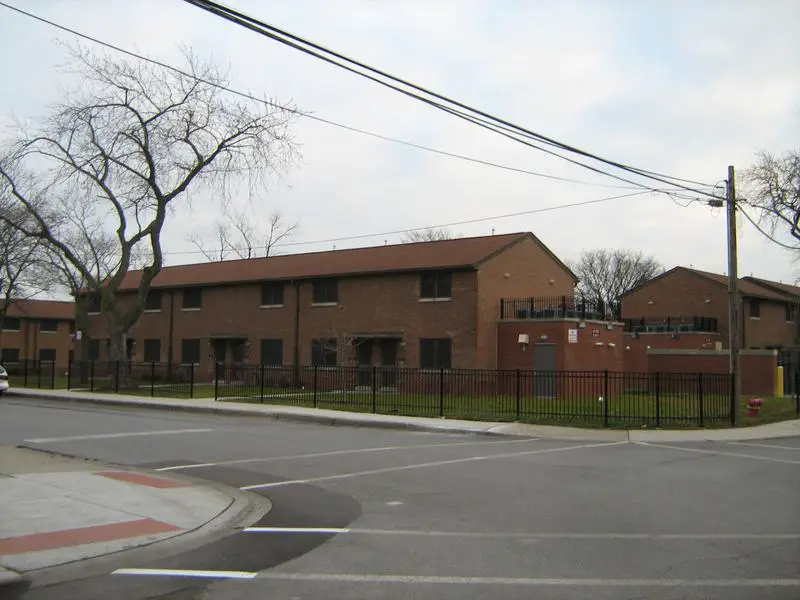
One of the southern-most neighborhoods in Chicago, South Deering used to be supported by local steel refineries. Those boom times are long gone at this point, and the area now ranks among the least appealing spots in the city.
The local economy is not kind to the 5,403 residents of South Deering. The unemployment rate holds at an eye-popping 9.2%. And the available jobs often afford only the barest minimum. The median income stands at $31,584.
Despite its troubles, South Deering has a long cultural heritage. People flock from all over to visit the famed seafood restaurant Calumet Fisheries.
/10
Population: 17,708
Violent Crimes Per 100k: 2,801
Property Crime Per 100k: 9,675
Median Home Value: $121,809 (9th worst)
Median Income: $39,713 (22nd worst)
More on Roseland: Data
/10
Population: 20,571
Violent Crimes Per 100k: 2,420
Property Crime Per 100k: 7,105
Median Home Value: $107,861 (4th worst)
Median Income: $32,258 (11th worst)
More on West Englewood: Data
Where’s the worst neighborhood in the city of Chicago? That would be right next door in West Englewood. This true hood has 20,571 people who live in the worst conditions in the city.
It ranks in the bottom three in home values and income levels and in the top 3 for crime.
Some Chicago neighborhoods are hard to tell apart. But you can tell who’s from West Englewood though. They’re the ones with the 40, a pistol, a beat up car and a pit bull.
/10
Population: 9,339
Violent Crimes Per 100k: 2,449
Property Crime Per 100k: 7,576
Median Home Value: $193,900 (32nd worst)
Median Income: $24,568 (2nd worst)
More on Washington Park: Data
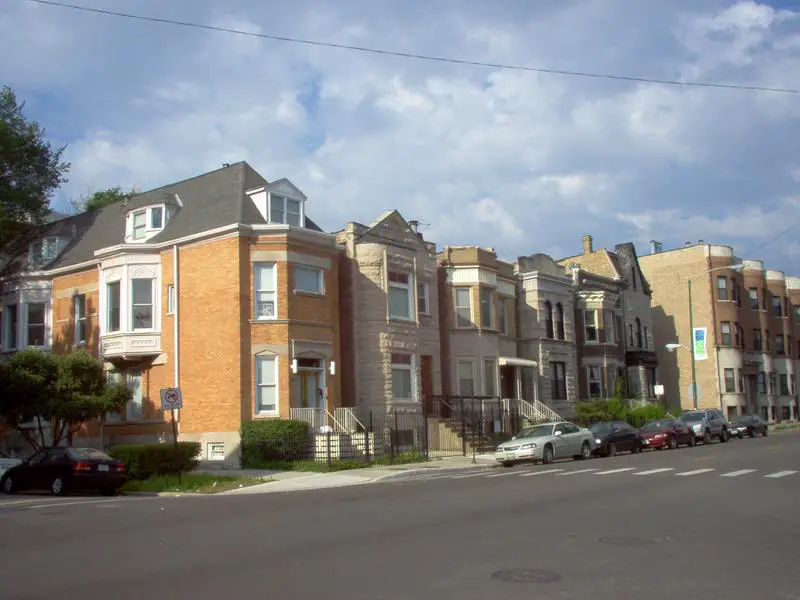
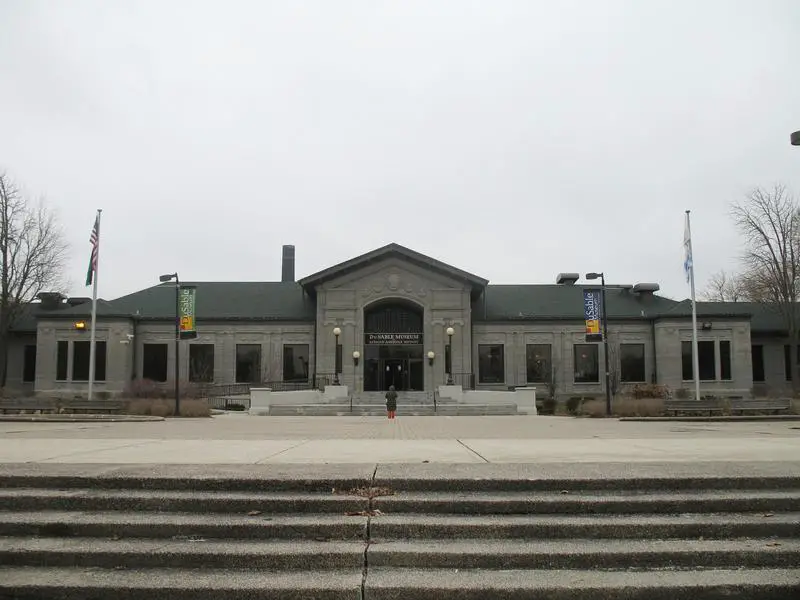
Looking for a job in Washington Park? Good luck. A dismal economy makes this section of Chicago’s South Side one of the toughest places to live in the city.
The area sports a massive unemployment rate of 10.6%. Even the available jobs don’t pay very well. The median income sits at just $24,568. Those low wages make it difficult to afford a house in the neighborhood. The median home price stands at $193,900.
Life in Washington Park has its upside. Most of all, there’s the namesake park. It also has notable cultural spots, such as the DuSable Museum of African American History.
/10
Population: 13,178
Violent Crimes Per 100k: 2,761
Property Crime Per 100k: 7,208
Median Home Value: $185,909 (29th worst)
Median Income: $32,582 (13th worst)
More on West Garfield Park: Data
/10
Population: 11,286
Violent Crimes Per 100k: 892
Property Crime Per 100k: 5,048
Median Home Value: $146,640 (18th worst)
Median Income: $31,984 (9th worst)
More on Grand Crossing: Data
Our next stop on our crummy tour through Chicago takes us to Grand Crossing, a hood with 11,286 people located between 67th and 79th. It’s near the lake, but you wouldn’t want to go near it.
Crime is 23rd worst, income levels are around $31,984, and homes average $146,640.
They certainly won’t be throwing any parades in Grand Crossing any time soon, that’s for sure.
/10
Population: 36,917
Violent Crimes Per 100k: 1,241
Property Crime Per 100k: 3,241
Median Home Value: $113,739 (6th worst)
Median Income: $26,828 (4th worst)
More on Englewood: Data
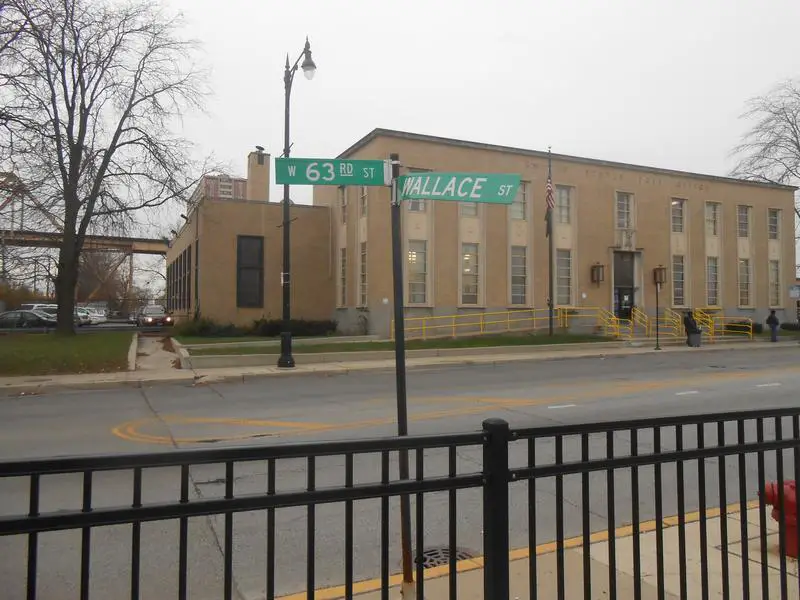
Englewood is a pretty notoriously horrible area in Chicago. Home to about 36,917 people, this hood sits between Garfield and 75th Street, on the west side of I-90. About 40% of people live in poverty, and crime is off the charts. There were about 40 murders in this neighborhood alone last year.
At one point, 100,000 people lived in the Englewood neighborhood. Now, it’s more like 36,917.
You’d be a fool to walk through this neighborhood in the day, and might not want to walk through here at night.
/10
Population: 1,575
Violent Crimes Per 100k: 855
Property Crime Per 100k: 4,837
Median Home Value: $191,980 (3worst)
Median Income: $29,302 (7th worst)
More on Fuller Park: Data
Historically, Fuller Park is one of the most dangerous neighborhoods in Chicago. Given its sagging economy, it’s not surprising that this part of the city’s South Side suffers a high crime rate. All told, these factors make Fuller Park one of the least appealing sections of Chicago.
High-paying jobs are scarce for the 1,575 residents of the area. The unemployment rate comes in at 8.6%, while the median income hovers at $29,302. The lack of funds makes it difficult to find affordable housing, especially with median home prices at $191,980.
Fuller Park doesn’t exist as concentrated urban blight, of course. It has many charming features. For instance, the namesake park contains an environmental education project housed in the Eden Place Nature Center.
/10
Population: 35,417
Violent Crimes Per 100k: 1,759
Property Crime Per 100k: 4,416
Median Home Value: $126,400 (11th worst)
Median Income: $26,510 (3rd worst)
More on North Lawndale: Data
Methodology: How we determined the most dangerous Chicago neighborhoods in 2025
To figure out how bad a place is to live in, we only needed to know what kinds of things people like and then decide what places have the least amount of those things. We plugged the following criteria into Saturday Night Science to get the worst neighborhoods in Chicago:
- High crime (Estimated)
- High unemployment (Less jobs)
- Low median income (Less pay)
- Low population density (No things to do)
- Low home values (No one’s willing to pay to live here)
Then, we ranked each neighborhood in Chicago, Illinois for each of these criteria from worst to best.
Next, we averaged the individual rankings for each criterion into a “Worst Score.”
The neighborhood with the lowest “Worst Score” ranks as the most dangerous neighborhood of Chicago.
The article is an opinion based on facts and is meant as infotainment. We updated this article for 2025. This report is our time ranking the worst neighborhoods to live in Chicago.
Skip to the end to see the list of all 77 neighborhoods ranked from worst to best.
Summary: The Worst Neighborhoods Around Chicago
Well, there you have it — the worst of the neighborhoods in Chicago with Riverdale landing at the bottom of the pack.
The worst neighborhoods in Chicago are Riverdale, South Deering, Roseland, West Englewood, Washington Park, West Garfield Park, Grand Crossing, Englewood, Fuller Park, and North Lawndale.
As mentioned earlier, the neighborhoods in Chicago aren’t all bad. Lincoln Park takes the cake as the best place to live in Chicago.
The best neighborhoods in Chicago are Lincoln Park, Edison Park, North Center, Loop, and Lake View.
We ranked the neighborhoods from worst to best in the chart below.
For more Illinois reading, check out:
Most Dangerous Neighborhoods To Live In Chicago For 2025?
| Rank | Neighborhood | Population | Home Value | Median Income |
|---|---|---|---|---|
| 1 | Riverdale | 165 | $85,600 | $19,067 |
| 2 | South Deering | 5,403 | $102,086 | $31,584 |
| 3 | Roseland | 17,708 | $121,809 | $39,713 |
| 4 | West Englewood | 20,571 | $107,861 | $32,258 |
| 5 | Washington Park | 9,339 | $193,900 | $24,568 |
| 6 | West Garfield Park | 13,178 | $185,909 | $32,582 |
| 7 | Grand Crossing | 11,286 | $146,640 | $31,984 |
| 8 | Englewood | 36,917 | $113,739 | $26,828 |
| 9 | Fuller Park | 1,575 | $191,980 | $29,302 |
| 10 | North Lawndale | 35,417 | $126,400 | $26,510 |
| 11 | New City | 41,153 | $110,614 | $32,588 |
| 12 | Pullman | 1,682 | $172,000 | $44,734 |
| 13 | Auburn Gresham | 45,607 | $115,671 | $32,470 |
| 14 | East Garfield Park | 18,665 | $222,929 | $28,558 |
| 15 | West Pullman | 26,366 | $103,967 | $46,956 |
| 16 | Chicago Lawn | 15,636 | $146,417 | $37,465 |
| 17 | Chatham | 18,683 | $172,638 | $49,214 |
| 18 | South Shore | 40,415 | $163,136 | $38,548 |
| 19 | Oakland | 3,673 | $342,700 | $43,288 |
| 20 | South Chicago | 28,988 | $143,288 | $44,876 |
| 21 | Grand Boulevard | 22,603 | $158,817 | $36,187 |
| 22 | Morgan Park | 15,013 | $145,444 | $53,937 |
| 23 | Hegewisch | 10,538 | $115,344 | $51,716 |
| 24 | Avalon Park | 3,004 | $197,100 | $42,981 |
| 25 | Douglas | 19,514 | $145,570 | $39,212 |
| 26 | Austin | 97,012 | $149,598 | $36,124 |
| 27 | Washington Heights | 5,668 | $154,075 | $56,829 |
| 28 | Ashburn | 14,277 | $183,500 | $78,791 |
| 29 | Woodlawn | 14,167 | $286,922 | $39,524 |
| 30 | Calumet Heights | 10,401 | $152,656 | $63,036 |
| 31 | Archer Heights | 50,854 | $186,394 | $36,405 |
| 32 | Burnside | 8,750 | $137,000 | $44,243 |
| 33 | East Side | 20,439 | $126,038 | $57,157 |
| 34 | Gage Park | 34,548 | $163,377 | $43,411 |
| 35 | Armour Square | 13,391 | $221,250 | $27,790 |
| 36 | Lower West Side | 33,150 | $208,108 | $40,724 |
| 37 | South Lawndale | 73,519 | $138,019 | $32,212 |
| 38 | Mckinley Park | 13,349 | $237,842 | $57,365 |
| 39 | North Park | 6,243 | $287,950 | $67,555 |
| 40 | Brighton Park | 45,668 | $194,459 | $48,123 |
| 41 | Clearing | 24,934 | $174,810 | $61,588 |
| 42 | Belmont Cragin | 77,859 | $204,209 | $46,654 |
| 43 | West Lawn | 33,502 | $200,950 | $58,820 |
| 44 | Beverly | 13,407 | $300,525 | $117,969 |
| 45 | West Elsdon | 18,486 | $199,358 | $63,586 |
| 46 | Kenwood | 8,429 | $345,162 | $58,158 |
| 47 | Garfield Ridge | 29,267 | $238,720 | $85,614 |
| 48 | Dunning | 7,475 | $266,325 | $80,857 |
| 49 | Near West Side | 14,333 | $417,656 | $74,122 |
| 50 | Irving Park | 14,312 | $441,985 | $75,411 |
| 51 | Humboldt Park | 37,291 | $316,581 | $59,973 |
| 52 | West Ridge | 73,660 | $235,196 | $54,223 |
| 53 | O’hare | 15,966 | $248,033 | $61,241 |
| 54 | Hermosa | 19,875 | $250,500 | $54,924 |
| 55 | Pottage Park | 64,285 | $248,275 | $59,222 |
| 56 | Uptown | 23,995 | $303,767 | $51,654 |
| 57 | Avondale | 17,551 | $380,113 | $89,062 |
| 58 | Hyde Park | 19,521 | $351,294 | $58,761 |
| 59 | Edgewater | 12,213 | $403,792 | $80,652 |
| 60 | Rogers Park | 53,425 | $248,403 | $52,286 |
| 61 | Forest Glen | 981 | $429,400 | $108,750 |
| 62 | Bridgeport | 39,979 | $333,879 | $56,947 |
| 63 | Near South Side | 21,930 | $318,671 | $80,646 |
| 64 | Norwood Park | 37,477 | $293,731 | $77,558 |
| 65 | Mount Greenwood | 16,972 | $269,300 | $108,072 |
| 66 | Near North Side | 83,049 | $434,335 | $97,802 |
| 67 | Montclare | 17,009 | $263,270 | $65,268 |
| 68 | Jefferson Park | 44,365 | $310,691 | $80,034 |
| 69 | Albany Park | 53,172 | $333,172 | $68,766 |
| 70 | West Town | 25,333 | $466,646 | $100,114 |
| 71 | Logan Square | 80,075 | $401,754 | $75,761 |
| 72 | Lincoln Square | 5,093 | $502,433 | $98,301 |
| 73 | Lake View | 57,436 | $556,847 | $128,310 |
| 74 | Loop | 32,384 | $331,150 | $98,220 |
| 75 | North Center | 20,512 | $661,838 | $133,268 |
| 76 | Edison Park | 10,847 | $446,771 | $138,875 |
| 77 | Lincoln Park | 14,732 | $702,485 | $132,432 |


