Denison SnackAbility
Overall SnackAbility
Crime in Denison summary. We use data from the FBI to determine the crime rates in Denison. Key points include:
There were 267 total crimes in Denison in the last reporting year.
The overall crime rate per 100,000 people in Denison is 989.7 / 100k people.
The violent crime rate per 100,000 people in Denison is 174.2 / 100k people.
The property crime rate per 100,000 people in Denison is 815.5 / 100k people.
Overall, crime in Denison is -53.30% below the national average.
Total Crimes
Below National Average
Crime In Denison Comparison Table
| Statistic | Count Raw |
Denison / 100k People |
Texas / 100k People |
National / 100k People |
|---|---|---|---|---|
| Total Crimes Per 100K | 267 | 989.7 | 2,429.9 | 2,119.2 |
| Violent Crime | 47 | 174.2 | 389.4 | 359.0 |
| Murder | 3 | 11.1 | 5.2 | 5.0 |
| Robbery | 4 | 14.8 | 63.5 | 61.0 |
| Aggravated Assault | 30 | 111.2 | 270.7 | 256.0 |
| Property Crime | 220 | 815.5 | 2,040.5 | 1,760.0 |
| Burglary | 48 | 177.9 | 284.3 | 229.0 |
| Larceny | 120 | 444.8 | 1,425.6 | 1,272.0 |
| Car Theft | 52 | 192.8 | 330.7 | 259.0 |
Source: FBI Uniform Crime Reporting (2024)
Cost of living in Denison summary. We use data on the cost of living to determine how expensive it is to live in Denison. Real estate prices drive most of the variance in cost of living around Texas. Key points include:
The cost of living in Denison is 91 with 100 being average.
The cost of living in Denison is 0.9x lower than the national average.
The median home value in Denison is $227,793.
The median income in Denison is $67,365.
Denison's Overall Cost Of Living
Lower Than The National Average
Cost Of Living In Denison Comparison Table
| Living Expense | Denison | Texas | National Average |
|---|---|---|---|
| Overall | 91 | 93 | 100 |
| Services | 97 | 100 | 100 |
| Groceries | 102 | 99 | 100 |
| Health | 72 | 81 | 100 |
| Housing | 98 | 97 | 100 |
| Transportation | 98 | 103 | 100 |
| Utilities | 101 | 100 | 100 |
Source: Cost of living index, normalized to US average = 100
Denison, TX Weather
The average high in Denison is 73.7° and the average low is 52.4°.
There are 56.7 days of precipitation each year.
Expect an average of 41.7 inches of precipitation each year with 1.7 inches of snow.
| Stat | Denison |
|---|---|
| Average Annual High | 73.7 |
| Average Annual Low | 52.4 |
| Annual Precipitation Days | 56.7 |
| Average Annual Precipitation | 41.7 |
| Average Annual Snowfall | 1.7 |
Average High
Days of Rain
Source: NOAA climate normals (30-year)
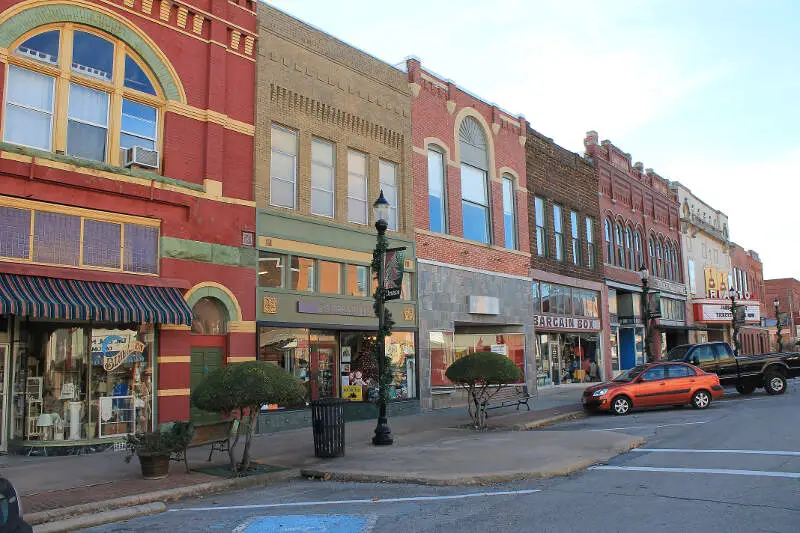
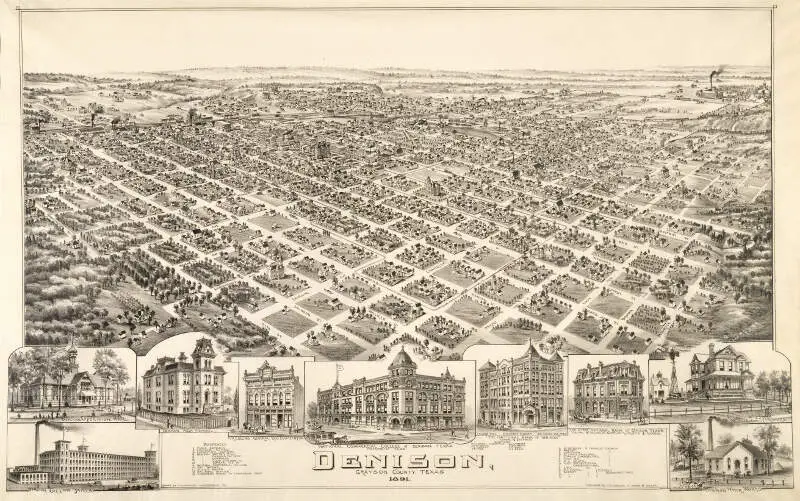
Denison, TX Photos
Rankings & Articles For Denison


Locations Around Denison
Map Of Denison, TX
Best Places Around Denison
Allen, TX
Population 110,265
Plano, TX
Population 290,594
Frisco, TX
Population 219,304
McKinney, TX
Population 210,600
Little Elm, TX
Population 54,820
Lakewood, WA
Population 62,937
Denton, TX
Population 152,866
Gainesville, TX
Population 17,883
Providence, UT
Population 8,947
Sherman, TX
Population 46,397
Denison Demographics And Statistics
Population over time in Denison
The current population in Denison is 25,778. The population has increased 13.4% from 2010.
| Year | Population | % Change |
|---|---|---|
| 2024 | 25,778 | 1.7% |
| 2023 | 25,347 | 1.9% |
| 2022 | 24,872 | 2.3% |
| 2021 | 24,324 | -2.1% |
| 2020 | 24,851 | 2.1% |
| 2019 | 24,340 | 2.2% |
| 2018 | 23,820 | 2.0% |
| 2017 | 23,342 | 1.1% |
| 2016 | 23,080 | 1.0% |
| 2015 | 22,846 | 0.4% |
| 2014 | 22,745 | 0.2% |
| 2013 | 22,697 | 0.2% |
| 2012 | 22,655 | -0.3% |
| 2011 | 22,719 | -0.0% |
| 2010 | 22,728 | - |
Race / Ethnicity in Denison
See the full breakdown
Denison is:
66.5% White with 17,148 White residents.
6.8% African American with 1,753 African American residents.
0.5% American Indian with 119 American Indian residents.
1.2% Asian with 307 Asian residents.
0.0% Hawaiian with 0 Hawaiian residents.
0.1% Other with 29 Other residents.
8.7% Two Or More with 2,244 Two Or More residents.
16.2% Hispanic with 4,178 Hispanic residents.
| Race | Denison | TX | USA |
|---|---|---|---|
| White | 66.5% | 39.1% | 57.4% |
| African American | 6.8% | 11.9% | 11.9% |
| American Indian | 0.5% | 0.1% | 0.5% |
| Asian | 1.2% | 5.5% | 5.9% |
| Hawaiian | 0.0% | 0.1% | 0.2% |
| Other | 0.1% | 0.4% | 0.6% |
| Two Or More | 8.7% | 3.1% | 4.3% |
| Hispanic | 16.2% | 39.7% | 19.3% |
Gender in Denison
See the full breakdown
Denison is 52.4% female with 13,502 female residents.
Denison is 47.6% male with 12,275 male residents.
| Gender | Denison | TX | USA |
|---|---|---|---|
| Female | 52.4% | 50.1% | 50.5% |
| Male | 47.6% | 49.9% | 49.5% |
Highest level of educational attainment in Denison for adults over 25
See the full breakdown
3.0% of adults in Denison completed < 9th grade.
7.0% of adults in Denison completed 9-12th grade.
34.0% of adults in Denison completed high school / ged.
25.0% of adults in Denison completed some college.
12.0% of adults in Denison completed associate's degree.
13.0% of adults in Denison completed bachelor's degree.
4.0% of adults in Denison completed master's degree.
1.0% of adults in Denison completed professional degree.
1.0% of adults in Denison completed doctorate degree.
| Education | Denison | TX | USA |
|---|---|---|---|
| < 9th Grade | 3.0% | 8.0% | 4.0% |
| 9-12th Grade | 7.0% | 7.0% | 6.0% |
| High School / GED | 34.0% | 24.0% | 26.0% |
| Some College | 25.0% | 20.0% | 19.0% |
| Associate's Degree | 12.0% | 8.0% | 9.0% |
| Bachelor's Degree | 13.0% | 21.0% | 22.0% |
| Master's Degree | 4.0% | 9.0% | 10.0% |
| Professional Degree | 1.0% | 2.0% | 2.0% |
| Doctorate Degree | 1.0% | 1.0% | 2.0% |
Household Income For Denison, Texas
See the full breakdown
3.1% of households in Denison earn Less than $10,000.
4.8% of households in Denison earn $10,000 to $14,999.
6.4% of households in Denison earn $15,000 to $24,999.
9.0% of households in Denison earn $25,000 to $34,999.
12.8% of households in Denison earn $35,000 to $49,999.
19.7% of households in Denison earn $50,000 to $74,999.
16.8% of households in Denison earn $75,000 to $99,999.
15.1% of households in Denison earn $100,000 to $149,999.
7.6% of households in Denison earn $150,000 to $199,999.
4.6% of households in Denison earn $200,000 or more.
| Income | Denison | TX | USA |
|---|---|---|---|
| Less than $10,000 | 3.1% | 5.0% | 5.0% |
| $10,000 to $14,999 | 4.8% | 3.3% | 3.4% |
| $15,000 to $24,999 | 6.4% | 6.3% | 6.3% |
| $25,000 to $34,999 | 9.0% | 6.8% | 6.6% |
| $35,000 to $49,999 | 12.8% | 10.5% | 10.1% |
| $50,000 to $74,999 | 19.7% | 16.1% | 15.5% |
| $75,000 to $99,999 | 16.8% | 12.8% | 12.6% |
| $100,000 to $149,999 | 15.1% | 17.3% | 17.5% |
| $150,000 to $199,999 | 7.6% | 9.5% | 9.6% |
| $200,000 or more | 4.6% | 12.5% | 13.4% |
Source: U.S. Census ACS 5-year estimates (2024)


