Desoto SnackAbility
Overall SnackAbility
Crime in DeSoto summary. We use data from the FBI to determine the crime rates in DeSoto. Key points include:
There were 1,112 total crimes in DeSoto in the last reporting year.
The overall crime rate per 100,000 people in DeSoto is 1,968.6 / 100k people.
The violent crime rate per 100,000 people in DeSoto is 325.7 / 100k people.
The property crime rate per 100,000 people in DeSoto is 1,642.8 / 100k people.
Overall, crime in DeSoto is -7.11% below the national average.
Total Crimes
Below National Average
Crime In DeSoto Comparison Table
| Statistic | Count Raw |
DeSoto / 100k People |
Texas / 100k People |
National / 100k People |
|---|---|---|---|---|
| Total Crimes Per 100K | 1,112 | 1,968.6 | 2,429.9 | 2,119.2 |
| Violent Crime | 184 | 325.7 | 389.4 | 359.0 |
| Murder | 1 | 1.8 | 5.2 | 5.0 |
| Robbery | 32 | 56.6 | 63.5 | 61.0 |
| Aggravated Assault | 124 | 219.5 | 270.7 | 256.0 |
| Property Crime | 928 | 1,642.8 | 2,040.5 | 1,760.0 |
| Burglary | 99 | 175.3 | 284.3 | 229.0 |
| Larceny | 641 | 1,134.8 | 1,425.6 | 1,272.0 |
| Car Theft | 188 | 332.8 | 330.7 | 259.0 |
Source: FBI Uniform Crime Reporting (2024)
Cost of living in DeSoto summary. We use data on the cost of living to determine how expensive it is to live in DeSoto. Real estate prices drive most of the variance in cost of living around Texas. Key points include:
The cost of living in DeSoto is 102 with 100 being average.
The cost of living in DeSoto is 1.0x higher than the national average.
The median home value in DeSoto is $338,709.
The median income in DeSoto is $82,782.
Desoto's Overall Cost Of Living
Higher Than The National Average
Cost Of Living In DeSoto Comparison Table
| Living Expense | DeSoto | Texas | National Average |
|---|---|---|---|
| Overall | 102 | 93 | 100 |
| Services | 99 | 100 | 100 |
| Groceries | 101 | 99 | 100 |
| Health | 112 | 81 | 100 |
| Housing | 100 | 97 | 100 |
| Transportation | 101 | 103 | 100 |
| Utilities | 93 | 100 | 100 |
Source: Cost of living index, normalized to US average = 100
Desoto, TX Weather
The average high in DeSoto is 76.4° and the average low is 55.0°.
There are 58.4 days of precipitation each year.
Expect an average of 38.3 inches of precipitation each year with 0.6 inches of snow.
| Stat | DeSoto |
|---|---|
| Average Annual High | 76.4 |
| Average Annual Low | 55.0 |
| Annual Precipitation Days | 58.4 |
| Average Annual Precipitation | 38.3 |
| Average Annual Snowfall | 0.6 |
Average High
Days of Rain
Source: NOAA climate normals (30-year)
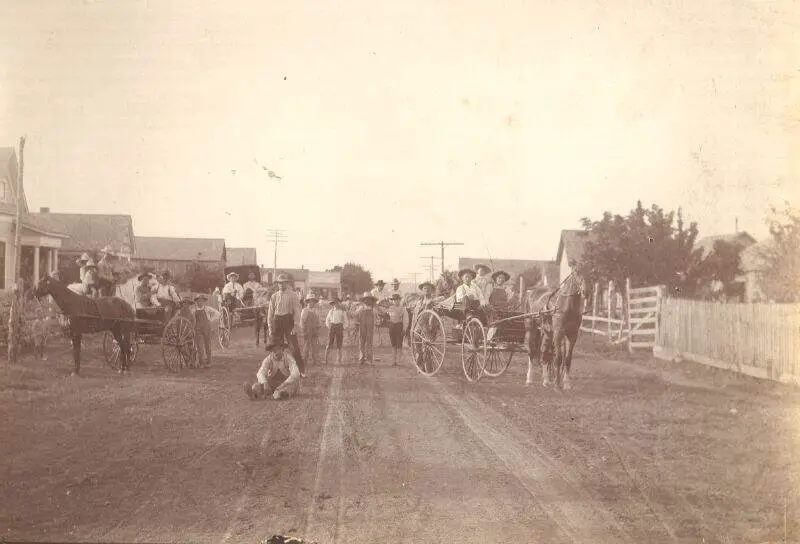
Desoto, TX Photos

1 Reviews & Comments About DeSoto

Moderate crime rate, Good level of education in schools
Cedar ridge nature preserve
Rankings & Articles For DeSoto


Locations Around DeSoto
Map Of DeSoto, TX
Best Places Around DeSoto
University Park, TX
Population 25,155
Mansfield, TX
Population 77,510
Irving, TX
Population 256,492
Arlington, TX
Population 397,742
Duncanville, TX
Population 39,683
Waxahachie, TX
Population 45,347
Grand Prairie, TX
Population 201,883
Red Oak, TX
Population 17,077
Midlothian, TX
Population 39,356
Cedar Hill, TX
Population 48,879
DeSoto Demographics And Statistics
Population over time in DeSoto
The current population in DeSoto is 56,211. The population has increased 20.6% from 2010.
| Year | Population | % Change |
|---|---|---|
| 2024 | 56,211 | 0.6% |
| 2023 | 55,896 | 0.0% |
| 2022 | 55,882 | 0.2% |
| 2021 | 55,761 | 4.9% |
| 2020 | 53,170 | 0.2% |
| 2019 | 53,090 | 0.1% |
| 2018 | 53,030 | 0.8% |
| 2017 | 52,596 | 1.4% |
| 2016 | 51,854 | 0.7% |
| 2015 | 51,478 | 1.3% |
| 2014 | 50,837 | 1.6% |
| 2013 | 50,014 | 2.0% |
| 2012 | 49,011 | 2.6% |
| 2011 | 47,786 | 2.5% |
| 2010 | 46,624 | - |
Race / Ethnicity in DeSoto
See the full breakdown
DeSoto is:
8.6% White with 4,858 White residents.
67.0% African American with 37,676 African American residents.
0.0% American Indian with 13 American Indian residents.
0.9% Asian with 526 Asian residents.
0.0% Hawaiian with 0 Hawaiian residents.
0.8% Other with 451 Other residents.
3.7% Two Or More with 2,066 Two Or More residents.
18.9% Hispanic with 10,621 Hispanic residents.
| Race | DeSoto | TX | USA |
|---|---|---|---|
| White | 8.6% | 39.1% | 57.4% |
| African American | 67.0% | 11.9% | 11.9% |
| American Indian | 0.0% | 0.1% | 0.5% |
| Asian | 0.9% | 5.5% | 5.9% |
| Hawaiian | 0.0% | 0.1% | 0.2% |
| Other | 0.8% | 0.4% | 0.6% |
| Two Or More | 3.7% | 3.1% | 4.3% |
| Hispanic | 18.9% | 39.7% | 19.3% |
Gender in DeSoto
See the full breakdown
DeSoto is 53.2% female with 29,928 female residents.
DeSoto is 46.8% male with 26,283 male residents.
| Gender | DeSoto | TX | USA |
|---|---|---|---|
| Female | 53.2% | 50.1% | 50.5% |
| Male | 46.8% | 49.9% | 49.5% |
Highest level of educational attainment in DeSoto for adults over 25
See the full breakdown
3.0% of adults in DeSoto completed < 9th grade.
5.0% of adults in DeSoto completed 9-12th grade.
25.0% of adults in DeSoto completed high school / ged.
29.0% of adults in DeSoto completed some college.
8.0% of adults in DeSoto completed associate's degree.
17.0% of adults in DeSoto completed bachelor's degree.
10.0% of adults in DeSoto completed master's degree.
2.0% of adults in DeSoto completed professional degree.
1.0% of adults in DeSoto completed doctorate degree.
| Education | DeSoto | TX | USA |
|---|---|---|---|
| < 9th Grade | 3.0% | 8.0% | 4.0% |
| 9-12th Grade | 5.0% | 7.0% | 6.0% |
| High School / GED | 25.0% | 24.0% | 26.0% |
| Some College | 29.0% | 20.0% | 19.0% |
| Associate's Degree | 8.0% | 8.0% | 9.0% |
| Bachelor's Degree | 17.0% | 21.0% | 22.0% |
| Master's Degree | 10.0% | 9.0% | 10.0% |
| Professional Degree | 2.0% | 2.0% | 2.0% |
| Doctorate Degree | 1.0% | 1.0% | 2.0% |
Household Income For DeSoto, Texas
See the full breakdown
4.0% of households in DeSoto earn Less than $10,000.
2.1% of households in DeSoto earn $10,000 to $14,999.
5.5% of households in DeSoto earn $15,000 to $24,999.
5.4% of households in DeSoto earn $25,000 to $34,999.
9.4% of households in DeSoto earn $35,000 to $49,999.
18.5% of households in DeSoto earn $50,000 to $74,999.
14.6% of households in DeSoto earn $75,000 to $99,999.
20.7% of households in DeSoto earn $100,000 to $149,999.
10.4% of households in DeSoto earn $150,000 to $199,999.
9.5% of households in DeSoto earn $200,000 or more.
| Income | DeSoto | TX | USA |
|---|---|---|---|
| Less than $10,000 | 4.0% | 5.0% | 5.0% |
| $10,000 to $14,999 | 2.1% | 3.3% | 3.4% |
| $15,000 to $24,999 | 5.5% | 6.3% | 6.3% |
| $25,000 to $34,999 | 5.4% | 6.8% | 6.6% |
| $35,000 to $49,999 | 9.4% | 10.5% | 10.1% |
| $50,000 to $74,999 | 18.5% | 16.1% | 15.5% |
| $75,000 to $99,999 | 14.6% | 12.8% | 12.6% |
| $100,000 to $149,999 | 20.7% | 17.3% | 17.5% |
| $150,000 to $199,999 | 10.4% | 9.5% | 9.6% |
| $200,000 or more | 9.5% | 12.5% | 13.4% |
Source: U.S. Census ACS 5-year estimates (2024)


