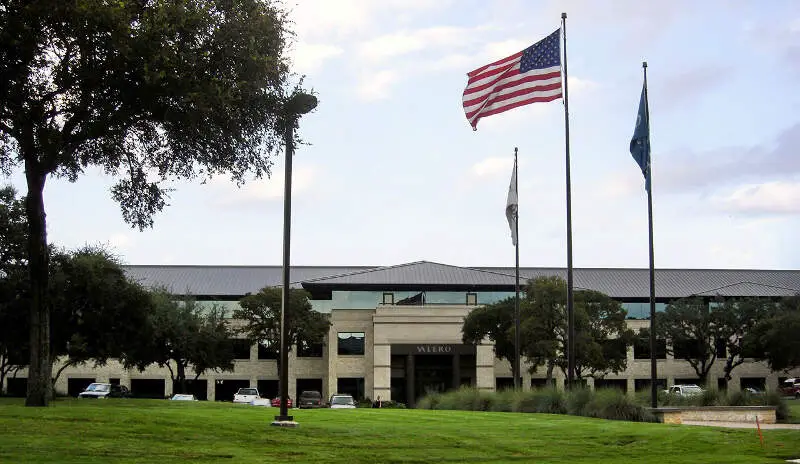
San Antonio, TX
Demographics And Statistics
Living In San Antonio, Texas Summary
Life in San Antonio research summary. HomeSnacks has been using Saturday Night Science to research the quality of life in San Antonio over the past nine years using Census, FBI, Zillow, and other primary data sources. Based on the most recently available data, we found the following about life in San Antonio:
The population in San Antonio is 1,458,954.
The median home value in San Antonio is $248,761.
The median income in San Antonio is $62,917.
The cost of living in San Antonio is 96 which is 1.0x lower than the national average.
The median rent in San Antonio is $1,258.
The unemployment rate in San Antonio is 5.8%.
The poverty rate in San Antonio is 17.1%.
The average high in San Antonio is 80.1° and the average low is 58.2°.
San Antonio SnackAbility
Overall SnackAbility
San Antonio, TX Crime Report
Crime in San Antonio summary. We use data from the FBI to determine the crime rates in San Antonio. Key points include:
There were 79,021 total crimes in San Antonio in the last reporting year.
The overall crime rate per 100,000 people in San Antonio is 5,217.8 / 100k people.
The violent crime rate per 100,000 people in San Antonio is 594.1 / 100k people.
The property crime rate per 100,000 people in San Antonio is 4,623.6 / 100k people.
Overall, crime in San Antonio is 146.21% above the national average.
Total Crimes
Above National Average
Crime In San Antonio Comparison Table
| Statistic | Count Raw |
San Antonio / 100k People |
Texas / 100k People |
National / 100k People |
|---|---|---|---|---|
| Total Crimes Per 100K | 79,021 | 5,217.8 | 2,429.9 | 2,119.2 |
| Violent Crime | 8,998 | 594.1 | 389.4 | 359.0 |
| Murder | 127 | 8.4 | 5.2 | 5.0 |
| Robbery | 1,641 | 108.4 | 63.5 | 61.0 |
| Aggravated Assault | 5,963 | 393.7 | 270.7 | 256.0 |
| Property Crime | 70,023 | 4,623.6 | 2,040.5 | 1,760.0 |
| Burglary | 7,505 | 495.6 | 284.3 | 229.0 |
| Larceny | 49,853 | 3,291.8 | 1,425.6 | 1,272.0 |
| Car Theft | 12,665 | 836.3 | 330.7 | 259.0 |
San Antonio, TX Cost Of Living
Cost of living in San Antonio summary. We use data on the cost of living to determine how expensive it is to live in San Antonio. Real estate prices drive most of the variance in cost of living around Texas. Key points include:
The cost of living in San Antonio is 96 with 100 being average.
The cost of living in San Antonio is 1.0x lower than the national average.
The median home value in San Antonio is $248,761.
The median income in San Antonio is $62,917.
San Antonio's Overall Cost Of Living
Lower Than The National Average
Cost Of Living In San Antonio Comparison Table
| Living Expense | San Antonio | Texas | National Average | |
|---|---|---|---|---|
| Overall | 96 | 92 | 100 | |
| Services | 101 | 97 | 100 | |
| Groceries | 94 | 97 | 100 | |
| Health | 104 | 93 | 100 | |
| Housing | 91 | 82 | 100 | |
| Transportation | 94 | 94 | 100 | |
| Utilities | 86 | 104 | 100 | |
San Antonio, TX Weather
The average high in San Antonio is 80.1° and the average low is 58.2°.
There are 46.4 days of precipitation each year.
Expect an average of 31.8 inches of precipitation each year with 0.4 inches of snow.
| Stat | San Antonio |
|---|---|
| Average Annual High | 80.1 |
| Average Annual Low | 58.2 |
| Annual Precipitation Days | 46.4 |
| Average Annual Precipitation | 31.8 |
| Average Annual Snowfall | 0.4 |
Average High
Days of Rain
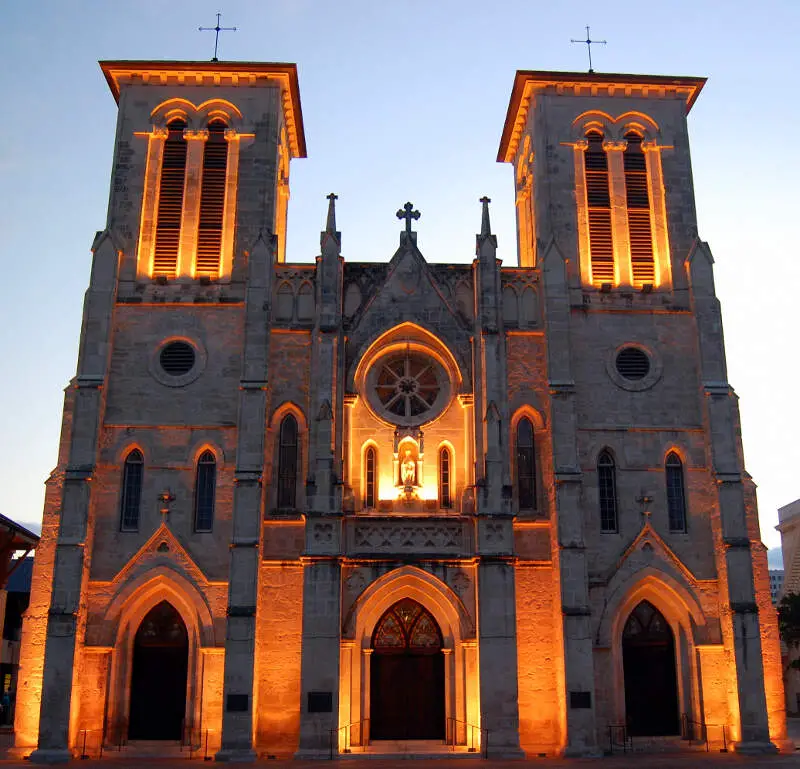
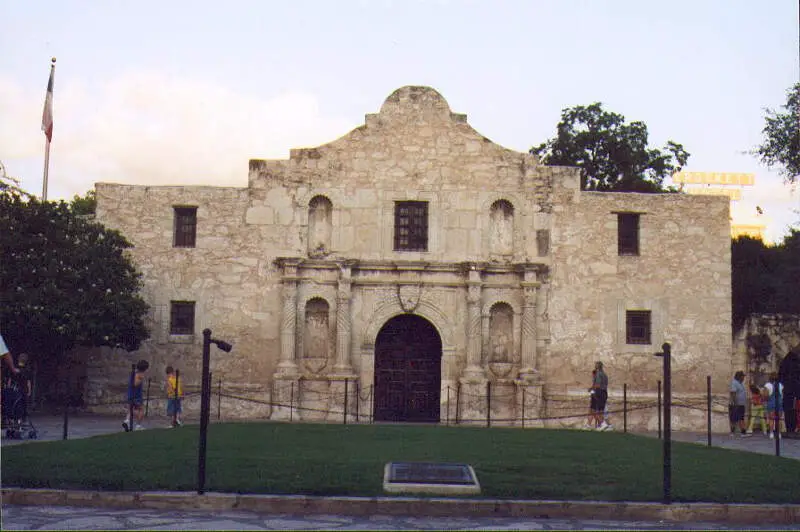
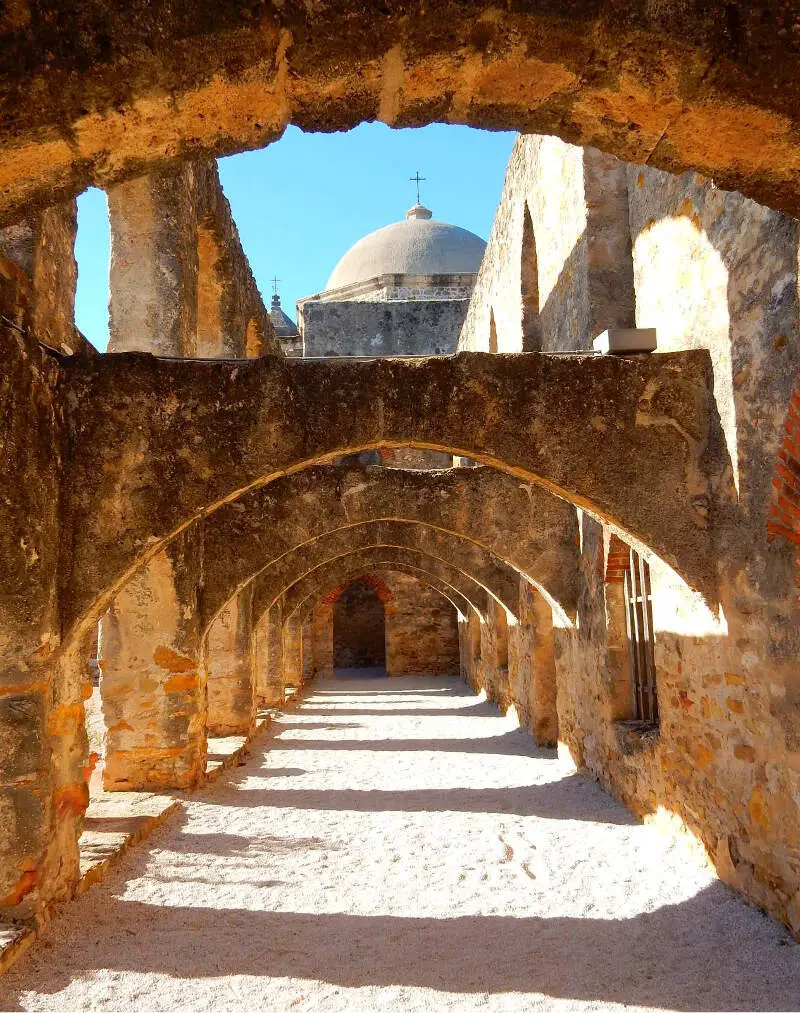
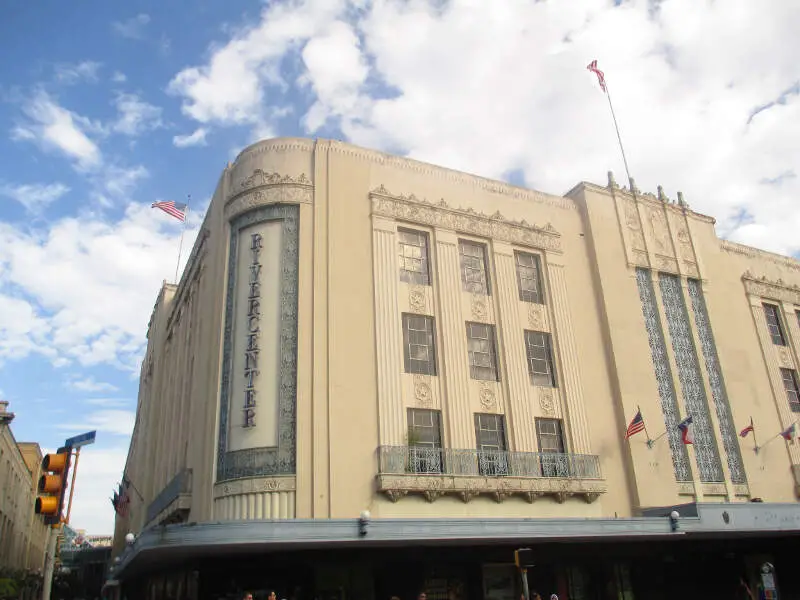
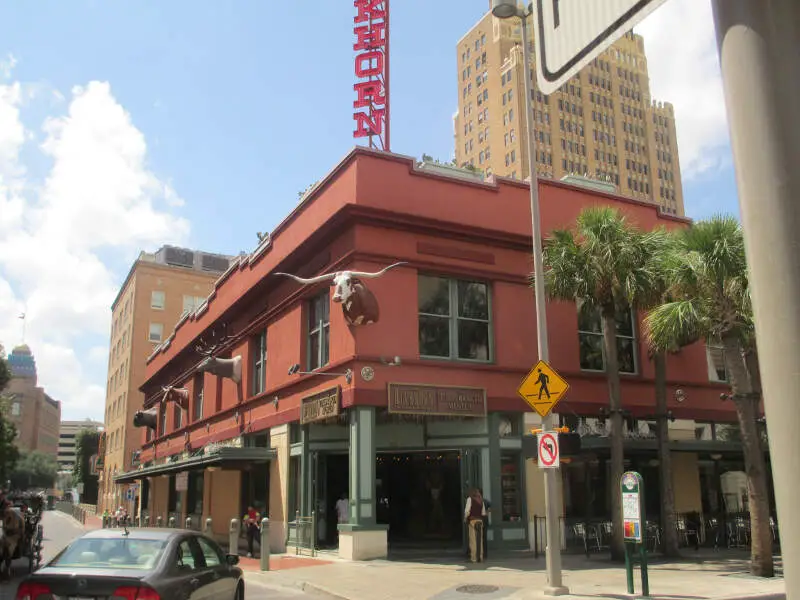
San Antonio, TX Photos


8 Reviews & Comments About San Antonio
/5

Elizabeth Porter - None
I live in San Antonio and I love it
Spurs for life
Virginia Diaz - None
I live in San Antonio! Is a bad city in Texas!
HomeSnacks User - 2018-07-15 05:45:11.108435
Very low crime rates. Schools tend to be top-notch, especially in NEISD. Food is fantastic, people are super friendly, and it has the largest tree canopy in any urban city in the USA
The Tex-Mex food is to die for. Watch out for 1604 and I-10 during rush hours, it gets nuts. Drivers are absolutely awful. AKA Military City USA... SO many military bases. And don't forget the Alamo
HomeSnacks User - 2018-07-15 23:41:30.610040
Crime is not to bad and the schools here are good. It is a very family oriented city and it is growing fast as well.
I like all the places you can eat at in San Antonio and there is a lot for tourist to do. I did not like that you have to drive everywhere and I wish the city was more urban but overall it's a good place to live in.
HomeSnacks User - 2018-08-03 16:48:51.955421
San Antonio just offers a higher quality of life than other cities in Texas. Good for Family and business.
We love the climate if you can withstand the hot summers where temp reach 100F or above on some days mainly in July and August.
HomeSnacks User - 2018-08-20 18:14:24.754695
, "Tell me about your experience" isn't an invitation to give an open-ended response. Unfortunately, many job candidates make that mistake, offering a lengthy, unfocused summary of their resume
The stars dressed in black in solidarity for the Time's Up and... Golden Globes: Dressed in black, who stood out -- the good and the bad.
HomeSnacks User - 2018-09-10 14:06:15.148269
I really enjoyed it when we went to to the Sea world down there when I was a teenager. Then in high school senior I played at tthe NBA Spurs gym against a team and then the next day we watched Michael Jordan and the wizards played the San Antonio Spurs. It was an awesome experience there. From the weather to the Hispanic culture was awesome experience. I would like to live down there too.
What stood out was the Alamo, the Riverwalk and the beautiful Hispanic culture there. It is awesome visiting there.
HomeSnacks User - 2018-09-19 02:37:04.506971
San Antonio Texas is one of my favorite places to visit, year after year! The locals are so friendly and helpful. This is truly a hospitality town. There are so many places to visit and things to do. The Riverwalk, to the Alamo, the San Antonio Zoo, Seaworld, Fiesta Texas, the list goes on. This city takes multiple visits to be able to see all the sights.
The shopping and restaurants in this town are top notch. There is no better place in all of Texas to have your fill of Tex-mex dining.
Be sure and find a local guide that will take you to the best authentic restaurants in town. Eat where the locals eat. You can find a chain restaurant anywhere, in any city. So definitely go off the beaten path to some hole in the wall restaurants for the best cuisine experience.
Be sure and ask for local drinks at any bar or club you go to.
Chamoy, sour pickles and hot Takis are the best garnishes for any margarita, beer or daquiri. Try a Michelada!
Especially during the Fiesta celebration that takes place in April. That would be the best time of year to visit San Antonio.
And if you want to avoid the touristy aspect of the Alamo, seek out the Espada missions Swing by the haunted railroad tracks too!
San Antonio Articles

Rankings for San Antonio in Texas


Locations Around San Antonio
Map Of San Antonio, TX
Best Places Around San Antonio
Cibolo, TX
Population 33,829
Converse, TX
Population 28,764
Timberwood Park, TX
Population 34,980
Leon Valley, TX
Population 11,479
Live Oak, TX
Population 15,875
Schertz, TX
Population 43,128
San Antonio Demographics And Statistics
Population over time in San Antonio
The current population in San Antonio is 1,458,954. The population has increased 13.1% from 2010.
| Year | Population | % Change |
|---|---|---|
| 2023 | 1,458,954 | 0.9% |
| 2022 | 1,445,662 | 0.8% |
| 2021 | 1,434,540 | -6.2% |
| 2020 | 1,529,133 | 1.4% |
| 2019 | 1,508,083 | 1.5% |
| 2018 | 1,486,521 | 1.7% |
| 2017 | 1,461,623 | 1.5% |
| 2016 | 1,439,358 | 1.8% |
| 2015 | 1,413,881 | 2.1% |
| 2014 | 1,385,438 | 1.9% |
| 2013 | 1,359,033 | 1.8% |
| 2012 | 1,335,287 | 1.7% |
| 2011 | 1,313,155 | 1.8% |
| 2010 | 1,290,196 | - |
Race / Ethnicity in San Antonio
San Antonio is:
23.3% White with 339,450 White residents.
6.5% African American with 94,108 African American residents.
0.1% American Indian with 1,914 American Indian residents.
2.9% Asian with 42,435 Asian residents.
0.1% Hawaiian with 1,503 Hawaiian residents.
0.4% Other with 6,440 Other residents.
2.3% Two Or More with 33,367 Two Or More residents.
64.4% Hispanic with 939,737 Hispanic residents.
| Race | San Antonio | TX | USA |
|---|---|---|---|
| White | 23.3% | 39.9% | 58.2% |
| African American | 6.5% | 11.9% | 12.0% |
| American Indian | 0.1% | 0.2% | 0.5% |
| Asian | 2.9% | 5.3% | 5.7% |
| Hawaiian | 0.1% | 0.1% | 0.2% |
| Other | 0.4% | 0.4% | 0.5% |
| Two Or More | 2.3% | 2.9% | 3.9% |
| Hispanic | 64.4% | 39.5% | 19.0% |
Gender in San Antonio
San Antonio is 50.5% female with 736,079 female residents.
San Antonio is 49.5% male with 722,874 male residents.
| Gender | San Antonio | TX | USA |
|---|---|---|---|
| Female | 50.5% | 50.1% | 50.5% |
| Male | 49.5% | 49.9% | 49.5% |
Highest level of educational attainment in San Antonio for adults over 25
7.0% of adults in San Antonio completed < 9th grade.
8.0% of adults in San Antonio completed 9-12th grade.
26.0% of adults in San Antonio completed high school / ged.
22.0% of adults in San Antonio completed some college.
8.0% of adults in San Antonio completed associate's degree.
18.0% of adults in San Antonio completed bachelor's degree.
8.0% of adults in San Antonio completed master's degree.
2.0% of adults in San Antonio completed professional degree.
1.0% of adults in San Antonio completed doctorate degree.
| Education | San Antonio | TX | USA |
|---|---|---|---|
| < 9th Grade | 7.0% | 7.0% | 5.0% |
| 9-12th Grade | 8.0% | 7.0% | 6.0% |
| High School / GED | 26.0% | 24.0% | 26.0% |
| Some College | 22.0% | 21.0% | 19.0% |
| Associate's Degree | 8.0% | 8.0% | 9.0% |
| Bachelor's Degree | 18.0% | 21.0% | 21.0% |
| Master's Degree | 8.0% | 9.0% | 10.0% |
| Professional Degree | 2.0% | 2.0% | 2.0% |
| Doctorate Degree | 1.0% | 1.0% | 2.0% |
Household Income For San Antonio, Texas
5.9% of households in San Antonio earn Less than $10,000.
4.4% of households in San Antonio earn $10,000 to $14,999.
7.9% of households in San Antonio earn $15,000 to $24,999.
9.2% of households in San Antonio earn $25,000 to $34,999.
12.4% of households in San Antonio earn $35,000 to $49,999.
18.6% of households in San Antonio earn $50,000 to $74,999.
13.4% of households in San Antonio earn $75,000 to $99,999.
15.0% of households in San Antonio earn $100,000 to $149,999.
6.6% of households in San Antonio earn $150,000 to $199,999.
6.8% of households in San Antonio earn $200,000 or more.
| Income | San Antonio | TX | USA |
|---|---|---|---|
| Less than $10,000 | 5.9% | 5.0% | 4.9% |
| $10,000 to $14,999 | 4.4% | 3.4% | 3.6% |
| $15,000 to $24,999 | 7.9% | 6.5% | 6.6% |
| $25,000 to $34,999 | 9.2% | 7.0% | 6.8% |
| $35,000 to $49,999 | 12.4% | 10.9% | 10.4% |
| $50,000 to $74,999 | 18.6% | 16.4% | 15.7% |
| $75,000 to $99,999 | 13.4% | 12.8% | 12.7% |
| $100,000 to $149,999 | 15.0% | 17.2% | 17.4% |
| $150,000 to $199,999 | 6.6% | 9.1% | 9.3% |
| $200,000 or more | 6.8% | 11.7% | 12.6% |


