Blacksburg SnackAbility
Overall SnackAbility
Crime in Blacksburg summary. We use data from the FBI to determine the crime rates in Blacksburg. Key points include:
There were 362 total crimes in Blacksburg in the last reporting year.
The overall crime rate per 100,000 people in Blacksburg is 791.5 / 100k people.
The violent crime rate per 100,000 people in Blacksburg is 76.5 / 100k people.
The property crime rate per 100,000 people in Blacksburg is 715.0 / 100k people.
Overall, crime in Blacksburg is -62.65% below the national average.
Total Crimes
Below National Average
Crime In Blacksburg Comparison Table
| Statistic | Count Raw |
Blacksburg / 100k People |
Virginia / 100k People |
National / 100k People |
|---|---|---|---|---|
| Total Crimes Per 100K | 362 | 791.5 | 1,787.6 | 2,119.2 |
| Violent Crime | 35 | 76.5 | 217.9 | 359.0 |
| Murder | 0 | 0.0 | 4.8 | 5.0 |
| Robbery | 1 | 2.2 | 33.1 | 61.0 |
| Aggravated Assault | 15 | 32.8 | 152.2 | 256.0 |
| Property Crime | 327 | 715.0 | 1,569.7 | 1,760.0 |
| Burglary | 31 | 67.8 | 108.7 | 229.0 |
| Larceny | 285 | 623.2 | 1,315.9 | 1,272.0 |
| Car Theft | 11 | 24.1 | 145.1 | 259.0 |
Source: FBI Uniform Crime Reporting (2024)
Cost of living in Blacksburg summary. We use data on the cost of living to determine how expensive it is to live in Blacksburg. Real estate prices drive most of the variance in cost of living around Virginia. Key points include:
The cost of living in Blacksburg is 120 with 100 being average.
The cost of living in Blacksburg is 1.2x higher than the national average.
The median home value in Blacksburg is $420,778.
The median income in Blacksburg is $50,182.
Blacksburg's Overall Cost Of Living
Higher Than The National Average
Cost Of Living In Blacksburg Comparison Table
| Living Expense | Blacksburg | Virginia | National Average |
|---|---|---|---|
| Overall | 120 | 112 | 100 |
| Services | 104 | 103 | 100 |
| Groceries | 106 | 104 | 100 |
| Health | 157 | 131 | 100 |
| Housing | 101 | 105 | 100 |
| Transportation | 105 | 105 | 100 |
| Utilities | 102 | 104 | 100 |
Source: Cost of living index, normalized to US average = 100
Blacksburg, VA Weather
The average high in Blacksburg is 64.1° and the average low is 42.2°.
There are 77.6 days of precipitation each year.
Expect an average of 40.0 inches of precipitation each year with 24.1 inches of snow.
| Stat | Blacksburg |
|---|---|
| Average Annual High | 64.1 |
| Average Annual Low | 42.2 |
| Annual Precipitation Days | 77.6 |
| Average Annual Precipitation | 40.0 |
| Average Annual Snowfall | 24.1 |
Average High
Days of Rain
Source: NOAA climate normals (30-year)
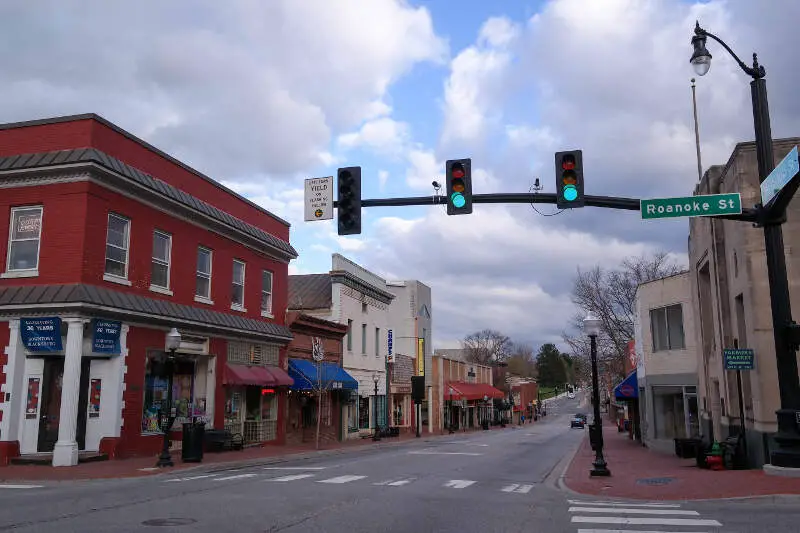
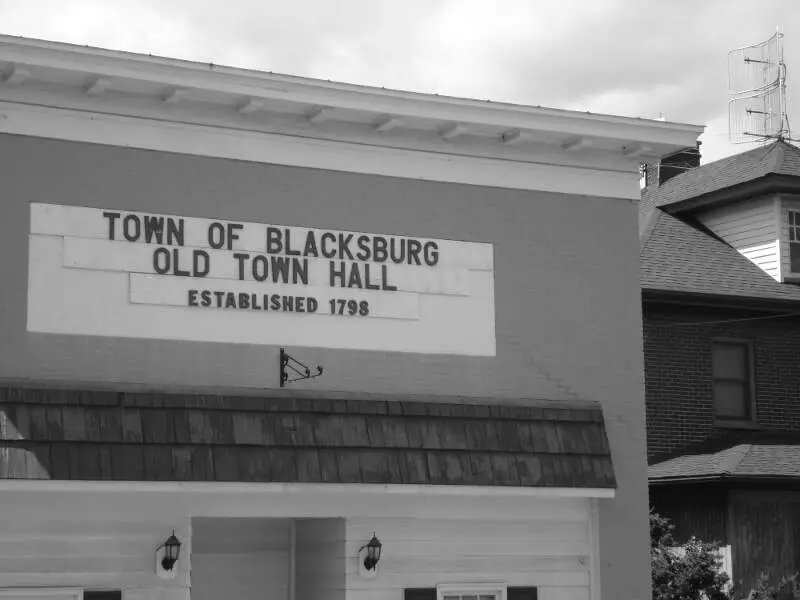
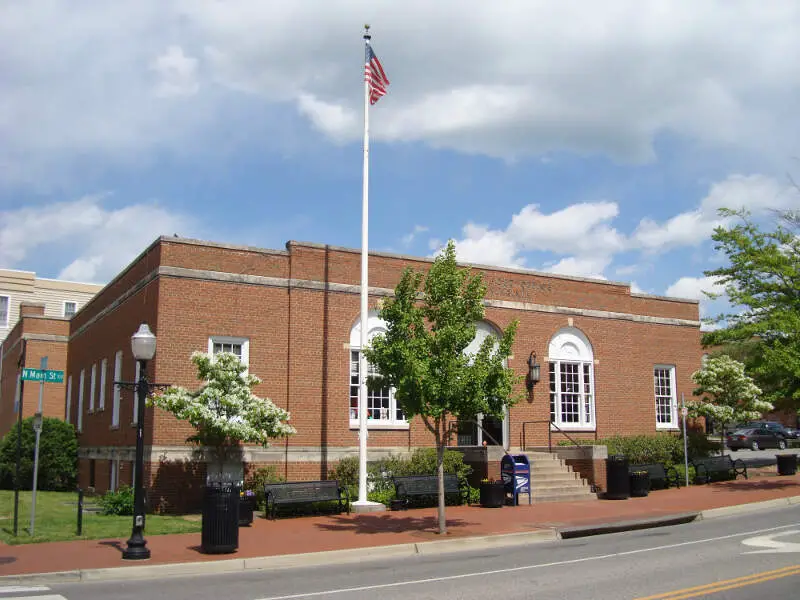
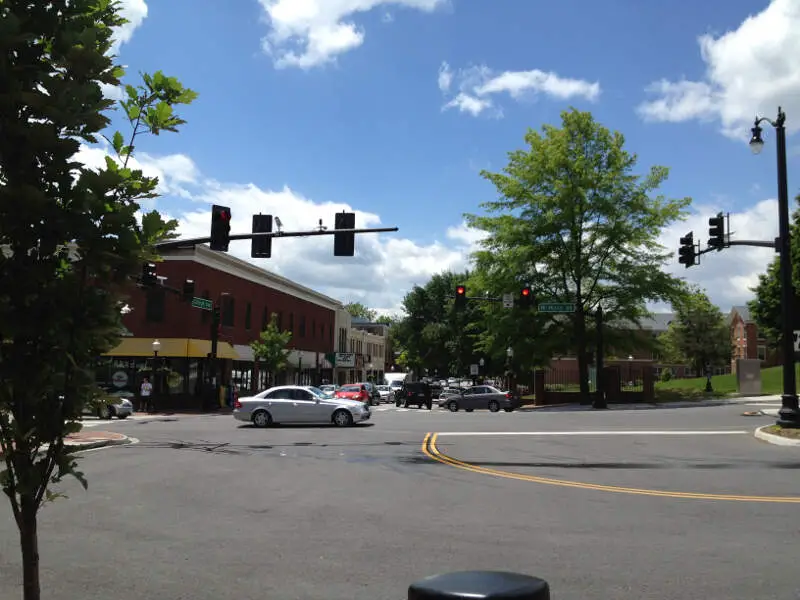
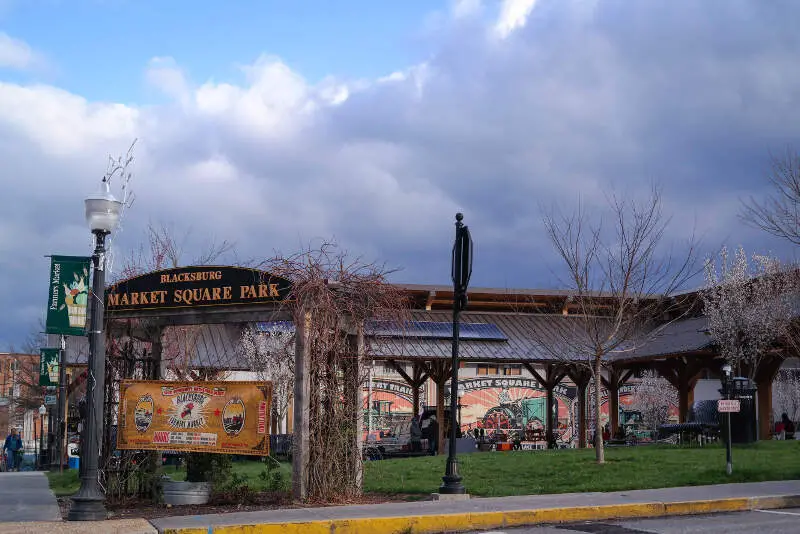
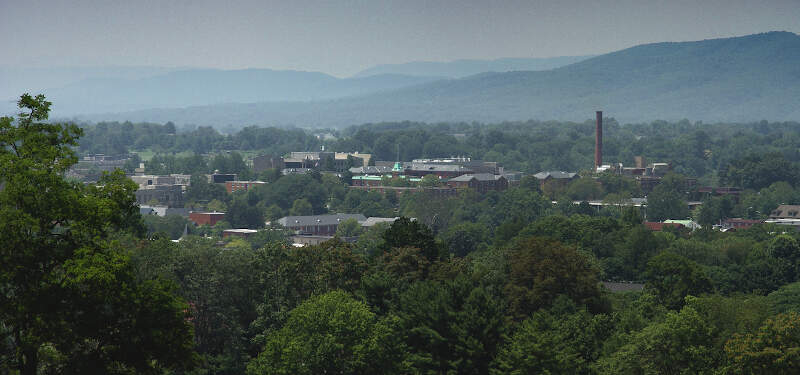
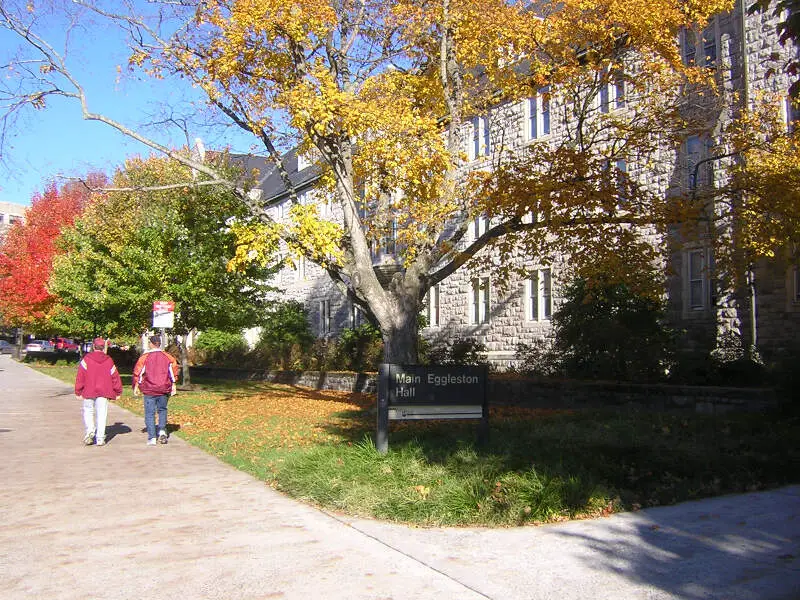
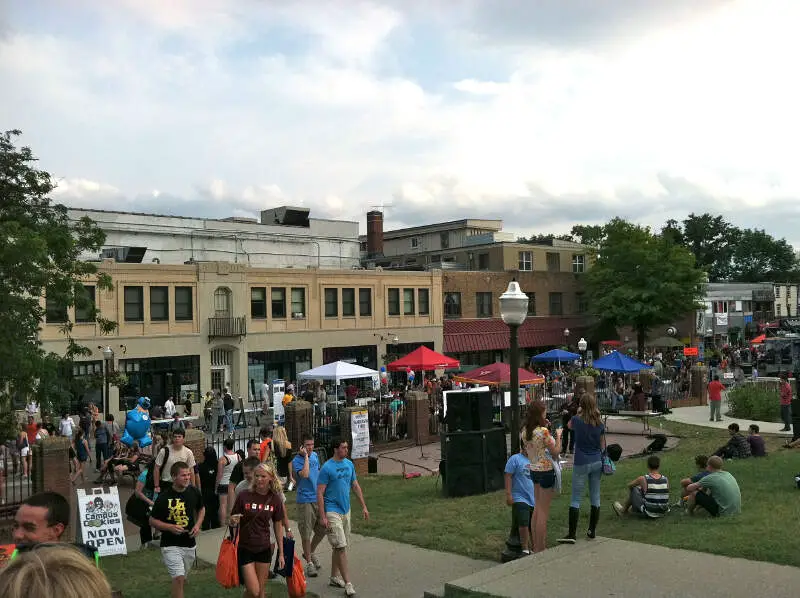
Blacksburg, VA Photos
Rankings & Articles For Blacksburg


Locations Around Blacksburg
Map Of Blacksburg, VA
Best Places Around Blacksburg
Cave Spring, VA
Population 25,742
Hollins, VA
Population 17,097
Salem, VA
Population 25,618
Christiansburg, VA
Population 22,720
Vinton, VA
Population 8,056
Radford, VA
Population 16,726
Roanoke, VA
Population 98,355
Covington, VA
Population 5,680
Pulaski, VA
Population 8,893
Martinsville, VA
Population 13,658
Blacksburg Demographics And Statistics
Population over time in Blacksburg
The current population in Blacksburg is 45,446. The population has increased 7.8% from 2010.
| Year | Population | % Change |
|---|---|---|
| 2024 | 45,446 | 0.3% |
| 2023 | 45,288 | 0.3% |
| 2022 | 45,147 | 1.7% |
| 2021 | 44,385 | -0.0% |
| 2020 | 44,395 | 0.2% |
| 2019 | 44,303 | 0.1% |
| 2018 | 44,245 | 0.4% |
| 2017 | 44,079 | 0.2% |
| 2016 | 43,973 | 1.0% |
| 2015 | 43,530 | 0.8% |
| 2014 | 43,204 | 0.8% |
| 2013 | 42,864 | 0.8% |
| 2012 | 42,539 | 0.3% |
| 2011 | 42,406 | 0.6% |
| 2010 | 42,149 | - |
Race / Ethnicity in Blacksburg
See the full breakdown
Blacksburg is:
75.0% White with 34,069 White residents.
3.9% African American with 1,779 African American residents.
0.1% American Indian with 66 American Indian residents.
11.4% Asian with 5,200 Asian residents.
0.3% Hawaiian with 117 Hawaiian residents.
0.6% Other with 277 Other residents.
3.7% Two Or More with 1,697 Two Or More residents.
4.9% Hispanic with 2,241 Hispanic residents.
| Race | Blacksburg | VA | USA |
|---|---|---|---|
| White | 75.0% | 58.4% | 57.4% |
| African American | 3.9% | 18.3% | 11.9% |
| American Indian | 0.1% | 0.1% | 0.5% |
| Asian | 11.4% | 6.9% | 5.9% |
| Hawaiian | 0.3% | 0.1% | 0.2% |
| Other | 0.6% | 0.6% | 0.6% |
| Two Or More | 3.7% | 4.7% | 4.3% |
| Hispanic | 4.9% | 11.0% | 19.3% |
Gender in Blacksburg
See the full breakdown
Blacksburg is 45.2% female with 20,530 female residents.
Blacksburg is 54.8% male with 24,916 male residents.
| Gender | Blacksburg | VA | USA |
|---|---|---|---|
| Female | 45.2% | 50.6% | 50.5% |
| Male | 54.8% | 49.4% | 49.5% |
Highest level of educational attainment in Blacksburg for adults over 25
See the full breakdown
1.0% of adults in Blacksburg completed < 9th grade.
1.0% of adults in Blacksburg completed 9-12th grade.
12.0% of adults in Blacksburg completed high school / ged.
12.0% of adults in Blacksburg completed some college.
5.0% of adults in Blacksburg completed associate's degree.
29.0% of adults in Blacksburg completed bachelor's degree.
24.0% of adults in Blacksburg completed master's degree.
2.0% of adults in Blacksburg completed professional degree.
14.0% of adults in Blacksburg completed doctorate degree.
| Education | Blacksburg | VA | USA |
|---|---|---|---|
| < 9th Grade | 1.0% | 2.0% | 4.0% |
| 9-12th Grade | 1.0% | 5.0% | 6.0% |
| High School / GED | 12.0% | 24.0% | 26.0% |
| Some College | 12.0% | 18.0% | 19.0% |
| Associate's Degree | 5.0% | 8.0% | 9.0% |
| Bachelor's Degree | 29.0% | 24.0% | 22.0% |
| Master's Degree | 24.0% | 14.0% | 10.0% |
| Professional Degree | 2.0% | 3.0% | 2.0% |
| Doctorate Degree | 14.0% | 2.0% | 2.0% |
Household Income For Blacksburg, Virginia
See the full breakdown
22.3% of households in Blacksburg earn Less than $10,000.
4.6% of households in Blacksburg earn $10,000 to $14,999.
5.8% of households in Blacksburg earn $15,000 to $24,999.
8.8% of households in Blacksburg earn $25,000 to $34,999.
8.5% of households in Blacksburg earn $35,000 to $49,999.
9.1% of households in Blacksburg earn $50,000 to $74,999.
8.6% of households in Blacksburg earn $75,000 to $99,999.
9.7% of households in Blacksburg earn $100,000 to $149,999.
8.4% of households in Blacksburg earn $150,000 to $199,999.
14.3% of households in Blacksburg earn $200,000 or more.
| Income | Blacksburg | VA | USA |
|---|---|---|---|
| Less than $10,000 | 22.3% | 4.2% | 5.0% |
| $10,000 to $14,999 | 4.6% | 2.7% | 3.4% |
| $15,000 to $24,999 | 5.8% | 5.2% | 6.3% |
| $25,000 to $34,999 | 8.8% | 5.7% | 6.6% |
| $35,000 to $49,999 | 8.5% | 8.8% | 10.1% |
| $50,000 to $74,999 | 9.1% | 14.3% | 15.5% |
| $75,000 to $99,999 | 8.6% | 12.1% | 12.6% |
| $100,000 to $149,999 | 9.7% | 18.1% | 17.5% |
| $150,000 to $199,999 | 8.4% | 11.1% | 9.6% |
| $200,000 or more | 14.3% | 17.7% | 13.4% |
Source: U.S. Census ACS 5-year estimates (2024)


