Martinsville SnackAbility
Overall SnackAbility
Crime in Martinsville summary. We use data from the FBI to determine the crime rates in Martinsville. Key points include:
There were 212 total crimes in Martinsville in the last reporting year.
The overall crime rate per 100,000 people in Martinsville is 1,517.8 / 100k people.
The violent crime rate per 100,000 people in Martinsville is 386.6 / 100k people.
The property crime rate per 100,000 people in Martinsville is 1,131.2 / 100k people.
Overall, crime in Martinsville is -28.38% below the national average.
Total Crimes
Below National Average
Crime In Martinsville Comparison Table
| Statistic | Count Raw |
Martinsville / 100k People |
Virginia / 100k People |
National / 100k People |
|---|---|---|---|---|
| Total Crimes Per 100K | 212 | 1,517.8 | 1,787.6 | 2,119.2 |
| Violent Crime | 54 | 386.6 | 217.9 | 359.0 |
| Murder | 1 | 7.2 | 4.8 | 5.0 |
| Robbery | 2 | 14.3 | 33.1 | 61.0 |
| Aggravated Assault | 45 | 322.2 | 152.2 | 256.0 |
| Property Crime | 158 | 1,131.2 | 1,569.7 | 1,760.0 |
| Burglary | 15 | 107.4 | 108.7 | 229.0 |
| Larceny | 133 | 952.2 | 1,315.9 | 1,272.0 |
| Car Theft | 10 | 71.6 | 145.1 | 259.0 |
Source: FBI Uniform Crime Reporting (2024)
Cost of living in Martinsville summary. We use data on the cost of living to determine how expensive it is to live in Martinsville. Real estate prices drive most of the variance in cost of living around Virginia. Key points include:
The cost of living in Martinsville is 89 with 100 being average.
The cost of living in Martinsville is 0.9x lower than the national average.
The median home value in Martinsville is $133,032.
The median income in Martinsville is $46,727.
Martinsville's Overall Cost Of Living
Lower Than The National Average
Cost Of Living In Martinsville Comparison Table
| Living Expense | Martinsville | Virginia | National Average |
|---|---|---|---|
| Overall | 89 | 112 | 100 |
| Services | 101 | 103 | 100 |
| Groceries | 105 | 104 | 100 |
| Health | 51 | 131 | 100 |
| Housing | 102 | 105 | 100 |
| Transportation | 100 | 105 | 100 |
| Utilities | 103 | 104 | 100 |
Source: Cost of living index, normalized to US average = 100
Martinsville, VA Weather
The average high in Martinsville is 68.5° and the average low is 44.8°.
There are 84.3 days of precipitation each year.
Expect an average of 44.9 inches of precipitation each year with 6.6 inches of snow.
| Stat | Martinsville |
|---|---|
| Average Annual High | 68.5 |
| Average Annual Low | 44.8 |
| Annual Precipitation Days | 84.3 |
| Average Annual Precipitation | 44.9 |
| Average Annual Snowfall | 6.6 |
Average High
Days of Rain
Source: NOAA climate normals (30-year)
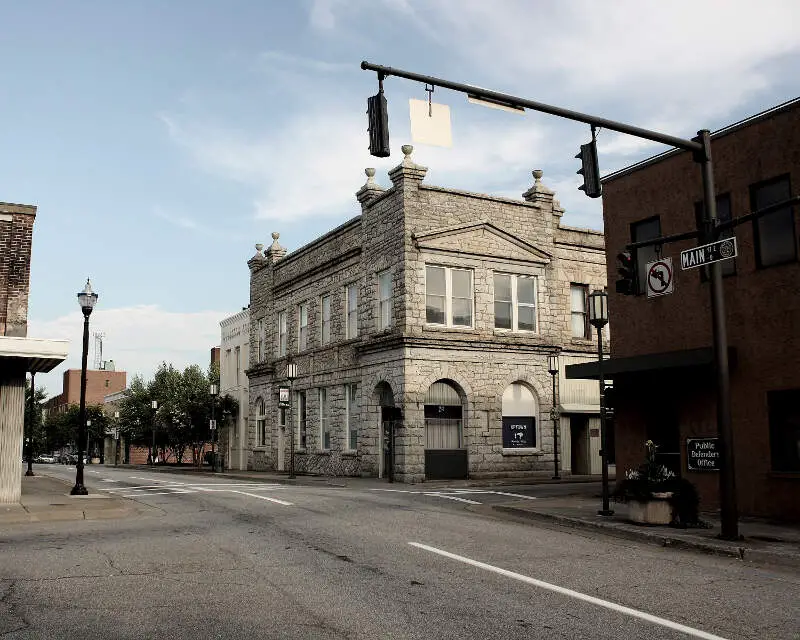
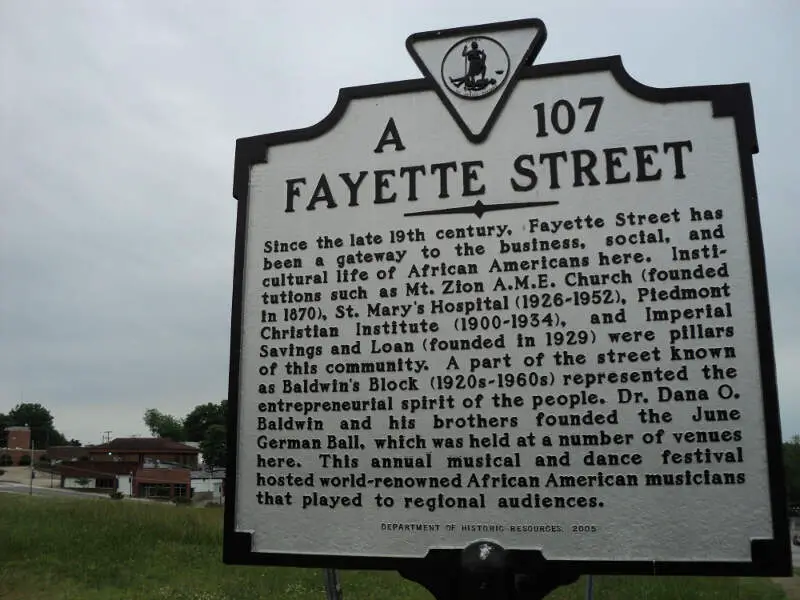
Martinsville, VA Photos
3 Reviews & Comments About Martinsville

I lived in Virginia all my life and my mom told me not to go to Martinsville after dark lol
Born and raised in martinsville, hated it nothing to do and very dangerous, but after I left for the service never thought I miss that h**l hole like I did
Watch out for rednecks there everywhere
How could Martinsville, VA make your WORST places to live list AND your BEST place to retire list- WOW...you people have no clue what you're talking about.
Would not take your advice on anything, that's for sure.
Rankings & Articles For Martinsville


Locations Around Martinsville
Map Of Martinsville, VA
Best Places Around Martinsville
King, NC
Population 7,408
Oak Ridge, NC
Population 7,744
Summerfield, NC
Population 11,116
Gibsonville, NC
Population 9,467
Elon, NC
Population 11,032
Kernersville, NC
Population 27,830
Cave Spring, VA
Population 25,742
Stokesdale, NC
Population 6,004
Winston-Salem, NC
Population 252,037
Greensboro, NC
Population 301,198
Martinsville Demographics And Statistics
Population over time in Martinsville
The current population in Martinsville is 13,658. The population has decreased 2.6% from 2010.
| Year | Population | % Change |
|---|---|---|
| 2024 | 13,658 | 0.5% |
| 2023 | 13,584 | 0.3% |
| 2022 | 13,539 | 0.5% |
| 2021 | 13,476 | 6.6% |
| 2020 | 12,646 | -1.6% |
| 2019 | 12,852 | -1.9% |
| 2018 | 13,101 | -1.2% |
| 2017 | 13,256 | -2.2% |
| 2016 | 13,551 | -0.5% |
| 2015 | 13,624 | -0.9% |
| 2014 | 13,745 | -0.5% |
| 2013 | 13,808 | -0.3% |
| 2012 | 13,854 | -0.2% |
| 2011 | 13,882 | -1.0% |
| 2010 | 14,029 | - |
Race / Ethnicity in Martinsville
See the full breakdown
Martinsville is:
41.7% White with 5,689 White residents.
43.9% African American with 5,999 African American residents.
0.0% American Indian with 0 American Indian residents.
2.9% Asian with 399 Asian residents.
0.0% Hawaiian with 0 Hawaiian residents.
0.4% Other with 55 Other residents.
2.5% Two Or More with 348 Two Or More residents.
8.6% Hispanic with 1,168 Hispanic residents.
| Race | Martinsville | VA | USA |
|---|---|---|---|
| White | 41.7% | 58.4% | 57.4% |
| African American | 43.9% | 18.3% | 11.9% |
| American Indian | 0.0% | 0.1% | 0.5% |
| Asian | 2.9% | 6.9% | 5.9% |
| Hawaiian | 0.0% | 0.1% | 0.2% |
| Other | 0.4% | 0.6% | 0.6% |
| Two Or More | 2.5% | 4.7% | 4.3% |
| Hispanic | 8.6% | 11.0% | 19.3% |
Gender in Martinsville
See the full breakdown
Martinsville is 53.5% female with 7,302 female residents.
Martinsville is 46.5% male with 6,356 male residents.
| Gender | Martinsville | VA | USA |
|---|---|---|---|
| Female | 53.5% | 50.6% | 50.5% |
| Male | 46.5% | 49.4% | 49.5% |
Highest level of educational attainment in Martinsville for adults over 25
See the full breakdown
6.0% of adults in Martinsville completed < 9th grade.
6.0% of adults in Martinsville completed 9-12th grade.
33.0% of adults in Martinsville completed high school / ged.
17.0% of adults in Martinsville completed some college.
17.0% of adults in Martinsville completed associate's degree.
14.0% of adults in Martinsville completed bachelor's degree.
6.0% of adults in Martinsville completed master's degree.
1.0% of adults in Martinsville completed professional degree.
0.0% of adults in Martinsville completed doctorate degree.
| Education | Martinsville | VA | USA |
|---|---|---|---|
| < 9th Grade | 6.0% | 2.0% | 4.0% |
| 9-12th Grade | 6.0% | 5.0% | 6.0% |
| High School / GED | 33.0% | 24.0% | 26.0% |
| Some College | 17.0% | 18.0% | 19.0% |
| Associate's Degree | 17.0% | 8.0% | 9.0% |
| Bachelor's Degree | 14.0% | 24.0% | 22.0% |
| Master's Degree | 6.0% | 14.0% | 10.0% |
| Professional Degree | 1.0% | 3.0% | 2.0% |
| Doctorate Degree | 0.0% | 2.0% | 2.0% |
Household Income For Martinsville, Virginia
See the full breakdown
7.0% of households in Martinsville earn Less than $10,000.
8.9% of households in Martinsville earn $10,000 to $14,999.
11.6% of households in Martinsville earn $15,000 to $24,999.
10.9% of households in Martinsville earn $25,000 to $34,999.
14.5% of households in Martinsville earn $35,000 to $49,999.
20.6% of households in Martinsville earn $50,000 to $74,999.
9.5% of households in Martinsville earn $75,000 to $99,999.
6.9% of households in Martinsville earn $100,000 to $149,999.
4.3% of households in Martinsville earn $150,000 to $199,999.
5.8% of households in Martinsville earn $200,000 or more.
| Income | Martinsville | VA | USA |
|---|---|---|---|
| Less than $10,000 | 7.0% | 4.2% | 5.0% |
| $10,000 to $14,999 | 8.9% | 2.7% | 3.4% |
| $15,000 to $24,999 | 11.6% | 5.2% | 6.3% |
| $25,000 to $34,999 | 10.9% | 5.7% | 6.6% |
| $35,000 to $49,999 | 14.5% | 8.8% | 10.1% |
| $50,000 to $74,999 | 20.6% | 14.3% | 15.5% |
| $75,000 to $99,999 | 9.5% | 12.1% | 12.6% |
| $100,000 to $149,999 | 6.9% | 18.1% | 17.5% |
| $150,000 to $199,999 | 4.3% | 11.1% | 9.6% |
| $200,000 or more | 5.8% | 17.7% | 13.4% |
Source: U.S. Census ACS 5-year estimates (2024)


