Bristol SnackAbility
Overall SnackAbility
Crime in Bristol summary. We use data from the FBI to determine the crime rates in Bristol. Key points include:
There were 581 total crimes in Bristol in the last reporting year.
The overall crime rate per 100,000 people in Bristol is 3,463.5 / 100k people.
The violent crime rate per 100,000 people in Bristol is 435.2 / 100k people.
The property crime rate per 100,000 people in Bristol is 3,028.3 / 100k people.
Overall, crime in Bristol is 63.43% above the national average.
Total Crimes
Above National Average
Crime In Bristol Comparison Table
| Statistic | Count Raw |
Bristol / 100k People |
Virginia / 100k People |
National / 100k People |
|---|---|---|---|---|
| Total Crimes Per 100K | 581 | 3,463.5 | 1,787.6 | 2,119.2 |
| Violent Crime | 73 | 435.2 | 217.9 | 359.0 |
| Murder | 0 | 0.0 | 4.8 | 5.0 |
| Robbery | 6 | 35.8 | 33.1 | 61.0 |
| Aggravated Assault | 51 | 304.0 | 152.2 | 256.0 |
| Property Crime | 508 | 3,028.3 | 1,569.7 | 1,760.0 |
| Burglary | 49 | 292.1 | 108.7 | 229.0 |
| Larceny | 430 | 2,563.3 | 1,315.9 | 1,272.0 |
| Car Theft | 29 | 172.9 | 145.1 | 259.0 |
Source: FBI Uniform Crime Reporting (2024)
Cost of living in Bristol summary. We use data on the cost of living to determine how expensive it is to live in Bristol. Real estate prices drive most of the variance in cost of living around Virginia. Key points include:
The cost of living in Bristol is 88 with 100 being average.
The cost of living in Bristol is 0.9x lower than the national average.
The median home value in Bristol is $201,474.
The median income in Bristol is $50,404.
Bristol's Overall Cost Of Living
Lower Than The National Average
Cost Of Living In Bristol Comparison Table
| Living Expense | Bristol | Virginia | National Average |
|---|---|---|---|
| Overall | 88 | 112 | 100 |
| Services | 95 | 103 | 100 |
| Groceries | 100 | 104 | 100 |
| Health | 73 | 131 | 100 |
| Housing | 95 | 105 | 100 |
| Transportation | 100 | 105 | 100 |
| Utilities | 99 | 104 | 100 |
Source: Cost of living index, normalized to US average = 100
Bristol, VA Weather
The average high in Bristol is 67.3° and the average low is 44.4°.
There are 96.1 days of precipitation each year.
Expect an average of 42.9 inches of precipitation each year with 12.1 inches of snow.
| Stat | Bristol |
|---|---|
| Average Annual High | 67.3 |
| Average Annual Low | 44.4 |
| Annual Precipitation Days | 96.1 |
| Average Annual Precipitation | 42.9 |
| Average Annual Snowfall | 12.1 |
Average High
Days of Rain
Source: NOAA climate normals (30-year)
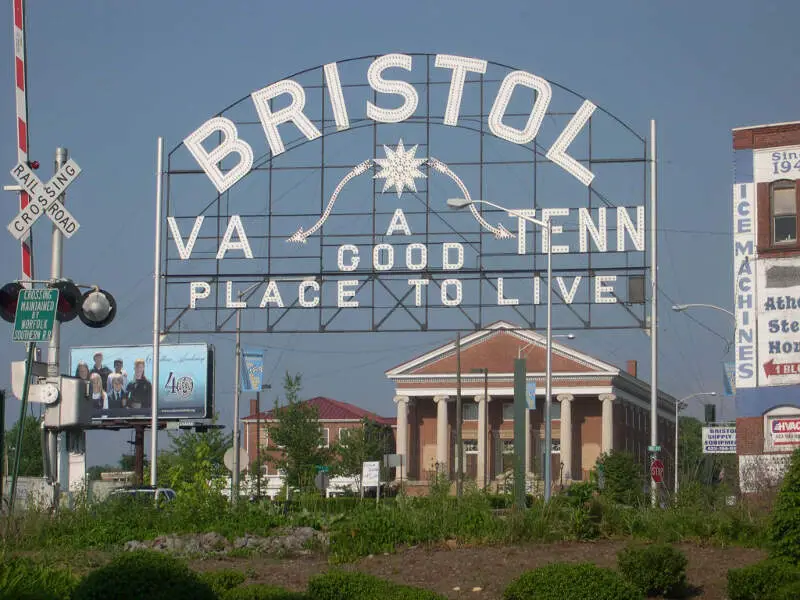
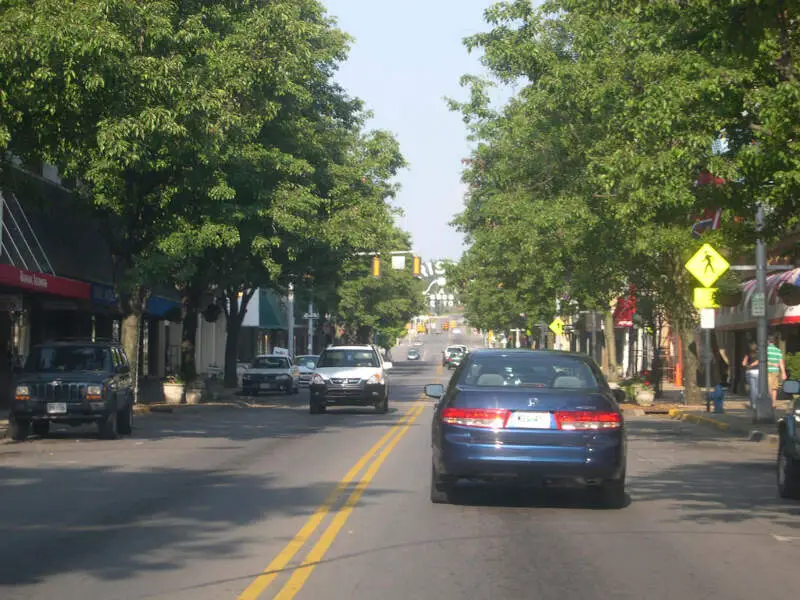
Bristol, VA Photos
Rankings & Articles For Bristol


Locations Around Bristol
Map Of Bristol, VA
Best Places Around Bristol
Boone, NC
Population 20,032
Mount Carmel, TN
Population 5,472
Jonesborough, TN
Population 6,232
Church Hill, TN
Population 7,139
Bloomingdale, TN
Population 9,292
Bristol, TN
Population 27,636
Kingsport, TN
Population 56,262
Elizabethton, TN
Population 14,374
Erwin, TN
Population 5,988
Greeneville, TN
Population 15,646
Bristol Demographics And Statistics
Population over time in Bristol
The current population in Bristol is 16,849. The population has decreased 4.8% from 2010.
| Year | Population | % Change |
|---|---|---|
| 2024 | 16,849 | -1.0% |
| 2023 | 17,024 | -0.1% |
| 2022 | 17,036 | 0.2% |
| 2021 | 16,996 | -0.4% |
| 2020 | 17,059 | 0.9% |
| 2019 | 16,912 | 0.4% |
| 2018 | 16,843 | -1.4% |
| 2017 | 17,077 | -1.5% |
| 2016 | 17,340 | -1.0% |
| 2015 | 17,524 | -0.4% |
| 2014 | 17,595 | -0.7% |
| 2013 | 17,713 | -0.2% |
| 2012 | 17,747 | 0.2% |
| 2011 | 17,718 | 0.1% |
| 2010 | 17,704 | - |
Race / Ethnicity in Bristol
See the full breakdown
Bristol is:
84.5% White with 14,230 White residents.
5.8% African American with 969 African American residents.
0.0% American Indian with 0 American Indian residents.
0.5% Asian with 76 Asian residents.
0.1% Hawaiian with 13 Hawaiian residents.
1.8% Other with 299 Other residents.
4.7% Two Or More with 797 Two Or More residents.
2.8% Hispanic with 465 Hispanic residents.
| Race | Bristol | VA | USA |
|---|---|---|---|
| White | 84.5% | 58.4% | 57.4% |
| African American | 5.8% | 18.3% | 11.9% |
| American Indian | 0.0% | 0.1% | 0.5% |
| Asian | 0.5% | 6.9% | 5.9% |
| Hawaiian | 0.1% | 0.1% | 0.2% |
| Other | 1.8% | 0.6% | 0.6% |
| Two Or More | 4.7% | 4.7% | 4.3% |
| Hispanic | 2.8% | 11.0% | 19.3% |
Gender in Bristol
See the full breakdown
Bristol is 50.8% female with 8,565 female residents.
Bristol is 49.2% male with 8,284 male residents.
| Gender | Bristol | VA | USA |
|---|---|---|---|
| Female | 50.8% | 50.6% | 50.5% |
| Male | 49.2% | 49.4% | 49.5% |
Highest level of educational attainment in Bristol for adults over 25
See the full breakdown
3.0% of adults in Bristol completed < 9th grade.
7.0% of adults in Bristol completed 9-12th grade.
36.0% of adults in Bristol completed high school / ged.
22.0% of adults in Bristol completed some college.
7.0% of adults in Bristol completed associate's degree.
16.0% of adults in Bristol completed bachelor's degree.
6.0% of adults in Bristol completed master's degree.
1.0% of adults in Bristol completed professional degree.
2.0% of adults in Bristol completed doctorate degree.
| Education | Bristol | VA | USA |
|---|---|---|---|
| < 9th Grade | 3.0% | 2.0% | 4.0% |
| 9-12th Grade | 7.0% | 5.0% | 6.0% |
| High School / GED | 36.0% | 24.0% | 26.0% |
| Some College | 22.0% | 18.0% | 19.0% |
| Associate's Degree | 7.0% | 8.0% | 9.0% |
| Bachelor's Degree | 16.0% | 24.0% | 22.0% |
| Master's Degree | 6.0% | 14.0% | 10.0% |
| Professional Degree | 1.0% | 3.0% | 2.0% |
| Doctorate Degree | 2.0% | 2.0% | 2.0% |
Household Income For Bristol, Virginia
See the full breakdown
8.7% of households in Bristol earn Less than $10,000.
7.1% of households in Bristol earn $10,000 to $14,999.
8.8% of households in Bristol earn $15,000 to $24,999.
10.5% of households in Bristol earn $25,000 to $34,999.
14.3% of households in Bristol earn $35,000 to $49,999.
16.3% of households in Bristol earn $50,000 to $74,999.
10.8% of households in Bristol earn $75,000 to $99,999.
12.7% of households in Bristol earn $100,000 to $149,999.
8.3% of households in Bristol earn $150,000 to $199,999.
2.4% of households in Bristol earn $200,000 or more.
| Income | Bristol | VA | USA |
|---|---|---|---|
| Less than $10,000 | 8.7% | 4.2% | 5.0% |
| $10,000 to $14,999 | 7.1% | 2.7% | 3.4% |
| $15,000 to $24,999 | 8.8% | 5.2% | 6.3% |
| $25,000 to $34,999 | 10.5% | 5.7% | 6.6% |
| $35,000 to $49,999 | 14.3% | 8.8% | 10.1% |
| $50,000 to $74,999 | 16.3% | 14.3% | 15.5% |
| $75,000 to $99,999 | 10.8% | 12.1% | 12.6% |
| $100,000 to $149,999 | 12.7% | 18.1% | 17.5% |
| $150,000 to $199,999 | 8.3% | 11.1% | 9.6% |
| $200,000 or more | 2.4% | 17.7% | 13.4% |
Source: U.S. Census ACS 5-year estimates (2024)


