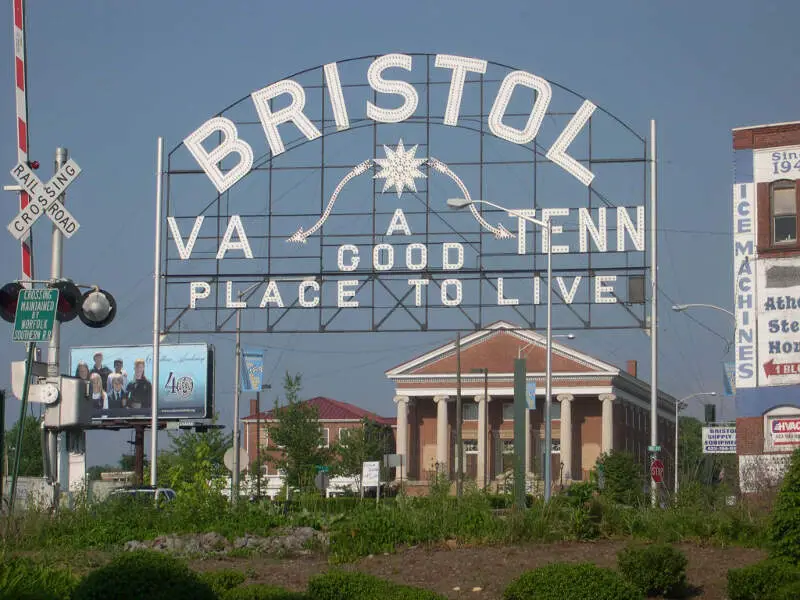
Bristol, TN
Demographics And Statistics
Living In Bristol, Tennessee Summary
Life in Bristol research summary. HomeSnacks has been using Saturday Night Science to research the quality of life in Bristol over the past nine years using Census, FBI, Zillow, and other primary data sources. Based on the most recently available data, we found the following about life in Bristol:
The population in Bristol is 27,490.
The median home value in Bristol is $232,078.
The median income in Bristol is $55,007.
The cost of living in Bristol is 88 which is 0.9x lower than the national average.
The median rent in Bristol is $764.
The unemployment rate in Bristol is 7.2%.
The poverty rate in Bristol is 14.1%.
The average high in Bristol is 67.8° and the average low is 44.8°.
Bristol SnackAbility
Overall SnackAbility
Bristol, TN Crime Report
Crime in Bristol summary. We use data from the FBI to determine the crime rates in Bristol. Key points include:
There were 652 total crimes in Bristol in the last reporting year.
The overall crime rate per 100,000 people in Bristol is 2,321.8 / 100k people.
The violent crime rate per 100,000 people in Bristol is 363.2 / 100k people.
The property crime rate per 100,000 people in Bristol is 1,958.5 / 100k people.
Overall, crime in Bristol is 9.56% above the national average.
Total Crimes
Above National Average
Crime In Bristol Comparison Table
| Statistic | Count Raw |
Bristol / 100k People |
Tennessee / 100k People |
National / 100k People |
|---|---|---|---|---|
| Total Crimes Per 100K | 652 | 2,321.8 | 2,624.4 | 2,119.2 |
| Violent Crime | 102 | 363.2 | 592.3 | 359.0 |
| Murder | 0 | 0.0 | 7.9 | 5.0 |
| Robbery | 6 | 21.4 | 58.4 | 61.0 |
| Aggravated Assault | 87 | 309.8 | 488.6 | 256.0 |
| Property Crime | 550 | 1,958.5 | 2,032.1 | 1,760.0 |
| Burglary | 87 | 309.8 | 251.8 | 229.0 |
| Larceny | 424 | 1,509.9 | 1,443.6 | 1,272.0 |
| Car Theft | 39 | 138.9 | 336.7 | 259.0 |
Bristol, TN Cost Of Living
Cost of living in Bristol summary. We use data on the cost of living to determine how expensive it is to live in Bristol. Real estate prices drive most of the variance in cost of living around Tennessee. Key points include:
The cost of living in Bristol is 88 with 100 being average.
The cost of living in Bristol is 0.9x lower than the national average.
The median home value in Bristol is $232,078.
The median income in Bristol is $55,007.
Bristol's Overall Cost Of Living
Lower Than The National Average
Cost Of Living In Bristol Comparison Table
| Living Expense | Bristol | Tennessee | National Average | |
|---|---|---|---|---|
| Overall | 88 | 90 | 100 | |
| Services | 91 | 93 | 100 | |
| Groceries | 97 | 99 | 100 | |
| Health | 89 | 87 | 100 | |
| Housing | 74 | 81 | 100 | |
| Transportation | 80 | 89 | 100 | |
| Utilities | 100 | 95 | 100 | |
Bristol, TN Weather
The average high in Bristol is 67.8° and the average low is 44.8°.
There are 86.3 days of precipitation each year.
Expect an average of 42.2 inches of precipitation each year with 12.3 inches of snow.
| Stat | Bristol |
|---|---|
| Average Annual High | 67.8 |
| Average Annual Low | 44.8 |
| Annual Precipitation Days | 86.3 |
| Average Annual Precipitation | 42.2 |
| Average Annual Snowfall | 12.3 |
Average High
Days of Rain
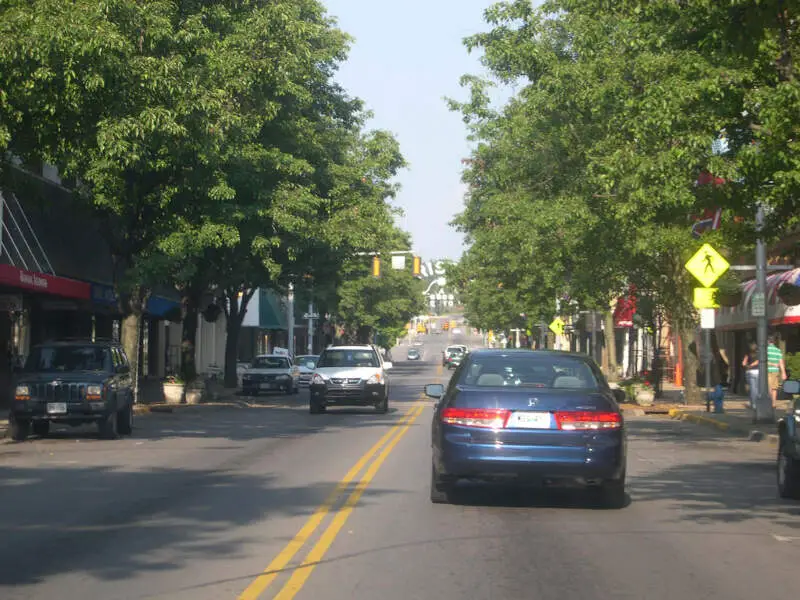
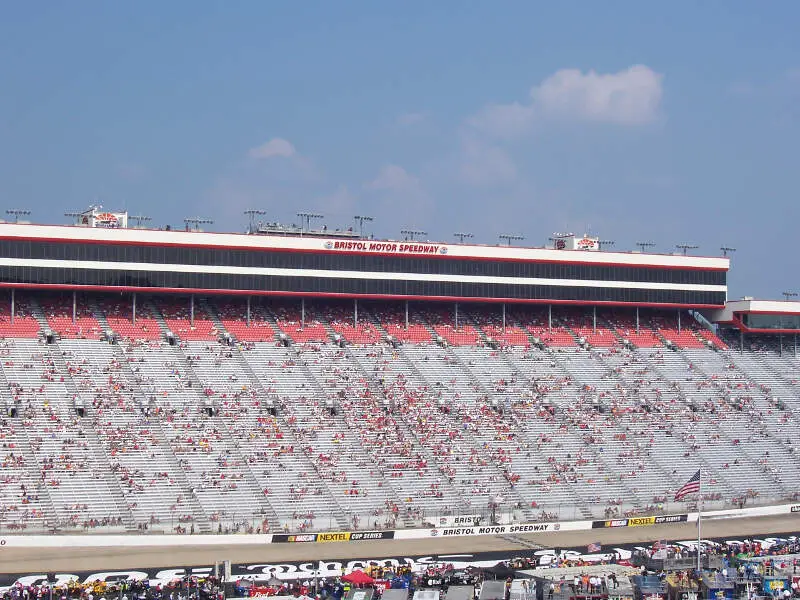
Bristol, TN Photos
1 Reviews & Comments About Bristol
/5

HomeSnacks User - 2018-09-10 15:10:03.310273
There isn't as much to do as preferred, but if you are looking for a quiet semi rural area Bristol is great. Some areas do have a higher drug problem, schools are good with dedicated teachers.
Certain areas of Bristol can be pretty drug filled. Steele Creek Park is a great spot to visit for hiking, play grounds, train ride, picnics, and paddle boats. They have a huge nature center with plenty of attractions for the little ones.
Rankings for Bristol in Tennessee


Locations Around Bristol
Map Of Bristol, TN
Best Places Around Bristol
Bloomingdale, TN
Population 8,840
Kingsport, TN
Population 55,807
Elizabethton, TN
Population 14,364
Bristol, VA
Population 17,024
Abingdon, VA
Population 8,332
Bristol Demographics And Statistics
Population over time in Bristol
The current population in Bristol is 27,490. The population has increased 4.0% from 2010.
| Year | Population | % Change |
|---|---|---|
| 2023 | 27,490 | 0.7% |
| 2022 | 27,307 | 0.6% |
| 2021 | 27,154 | 0.7% |
| 2020 | 26,973 | 0.5% |
| 2019 | 26,852 | 0.3% |
| 2018 | 26,766 | 0.4% |
| 2017 | 26,668 | -0.2% |
| 2016 | 26,734 | 0.2% |
| 2015 | 26,674 | -0.1% |
| 2014 | 26,705 | 0.1% |
| 2013 | 26,681 | 0.2% |
| 2012 | 26,639 | 0.2% |
| 2011 | 26,578 | 0.6% |
| 2010 | 26,427 | - |
Race / Ethnicity in Bristol
Bristol is:
89.3% White with 24,535 White residents.
2.6% African American with 720 African American residents.
0.1% American Indian with 19 American Indian residents.
0.4% Asian with 98 Asian residents.
0.0% Hawaiian with 0 Hawaiian residents.
0.2% Other with 52 Other residents.
3.4% Two Or More with 938 Two Or More residents.
4.1% Hispanic with 1,128 Hispanic residents.
| Race | Bristol | TN | USA |
|---|---|---|---|
| White | 89.3% | 71.5% | 58.2% |
| African American | 2.6% | 15.7% | 12.0% |
| American Indian | 0.1% | 0.1% | 0.5% |
| Asian | 0.4% | 1.8% | 5.7% |
| Hawaiian | 0.0% | 0.1% | 0.2% |
| Other | 0.2% | 0.4% | 0.5% |
| Two Or More | 3.4% | 3.3% | 3.9% |
| Hispanic | 4.1% | 7.1% | 19.0% |
Gender in Bristol
Bristol is 52.4% female with 14,418 female residents.
Bristol is 47.6% male with 13,072 male residents.
| Gender | Bristol | TN | USA |
|---|---|---|---|
| Female | 52.4% | 50.9% | 50.5% |
| Male | 47.6% | 49.1% | 49.5% |
Highest level of educational attainment in Bristol for adults over 25
3.0% of adults in Bristol completed < 9th grade.
5.0% of adults in Bristol completed 9-12th grade.
32.0% of adults in Bristol completed high school / ged.
21.0% of adults in Bristol completed some college.
9.0% of adults in Bristol completed associate's degree.
20.0% of adults in Bristol completed bachelor's degree.
7.0% of adults in Bristol completed master's degree.
2.0% of adults in Bristol completed professional degree.
1.0% of adults in Bristol completed doctorate degree.
| Education | Bristol | TN | USA |
|---|---|---|---|
| < 9th Grade | 3.0% | 4.0% | 5.0% |
| 9-12th Grade | 5.0% | 7.0% | 6.0% |
| High School / GED | 32.0% | 31.0% | 26.0% |
| Some College | 21.0% | 20.0% | 19.0% |
| Associate's Degree | 9.0% | 8.0% | 9.0% |
| Bachelor's Degree | 20.0% | 19.0% | 21.0% |
| Master's Degree | 7.0% | 8.0% | 10.0% |
| Professional Degree | 2.0% | 2.0% | 2.0% |
| Doctorate Degree | 1.0% | 1.0% | 2.0% |
Household Income For Bristol, Tennessee
4.4% of households in Bristol earn Less than $10,000.
5.2% of households in Bristol earn $10,000 to $14,999.
10.4% of households in Bristol earn $15,000 to $24,999.
9.8% of households in Bristol earn $25,000 to $34,999.
16.1% of households in Bristol earn $35,000 to $49,999.
16.8% of households in Bristol earn $50,000 to $74,999.
12.6% of households in Bristol earn $75,000 to $99,999.
14.6% of households in Bristol earn $100,000 to $149,999.
4.5% of households in Bristol earn $150,000 to $199,999.
5.5% of households in Bristol earn $200,000 or more.
| Income | Bristol | TN | USA |
|---|---|---|---|
| Less than $10,000 | 4.4% | 5.2% | 4.9% |
| $10,000 to $14,999 | 5.2% | 4.2% | 3.6% |
| $15,000 to $24,999 | 10.4% | 7.8% | 6.6% |
| $25,000 to $34,999 | 9.8% | 7.9% | 6.8% |
| $35,000 to $49,999 | 16.1% | 12.4% | 10.4% |
| $50,000 to $74,999 | 16.8% | 17.4% | 15.7% |
| $75,000 to $99,999 | 12.6% | 13.2% | 12.7% |
| $100,000 to $149,999 | 14.6% | 16.4% | 17.4% |
| $150,000 to $199,999 | 4.5% | 7.1% | 9.3% |
| $200,000 or more | 5.5% | 8.3% | 12.6% |


