Charlottesville SnackAbility
Overall SnackAbility
Crime in Charlottesville summary. We use data from the FBI to determine the crime rates in Charlottesville. Key points include:
There were 1,592 total crimes in Charlottesville in the last reporting year.
The overall crime rate per 100,000 people in Charlottesville is 3,550.1 / 100k people.
The violent crime rate per 100,000 people in Charlottesville is 359.0 / 100k people.
The property crime rate per 100,000 people in Charlottesville is 3,191.1 / 100k people.
Overall, crime in Charlottesville is 67.52% above the national average.
Total Crimes
Above National Average
Crime In Charlottesville Comparison Table
| Statistic | Count Raw |
Charlottesville / 100k People |
Virginia / 100k People |
National / 100k People |
|---|---|---|---|---|
| Total Crimes Per 100K | 1,592 | 3,550.1 | 1,787.6 | 2,119.2 |
| Violent Crime | 161 | 359.0 | 217.9 | 359.0 |
| Murder | 1 | 2.2 | 4.8 | 5.0 |
| Robbery | 27 | 60.2 | 33.1 | 61.0 |
| Aggravated Assault | 114 | 254.2 | 152.2 | 256.0 |
| Property Crime | 1,431 | 3,191.1 | 1,569.7 | 1,760.0 |
| Burglary | 108 | 240.8 | 108.7 | 229.0 |
| Larceny | 1,193 | 2,660.3 | 1,315.9 | 1,272.0 |
| Car Theft | 130 | 289.9 | 145.1 | 259.0 |
Source: FBI Uniform Crime Reporting (2024)
Cost of living in Charlottesville summary. We use data on the cost of living to determine how expensive it is to live in Charlottesville. Real estate prices drive most of the variance in cost of living around Virginia. Key points include:
The cost of living in Charlottesville is 124 with 100 being average.
The cost of living in Charlottesville is 1.2x higher than the national average.
The median home value in Charlottesville is $515,217.
The median income in Charlottesville is $74,824.
Charlottesville's Overall Cost Of Living
Higher Than The National Average
Cost Of Living In Charlottesville Comparison Table
| Living Expense | Charlottesville | Virginia | National Average |
|---|---|---|---|
| Overall | 124 | 112 | 100 |
| Services | 105 | 103 | 100 |
| Groceries | 105 | 104 | 100 |
| Health | 163 | 131 | 100 |
| Housing | 104 | 105 | 100 |
| Transportation | 107 | 105 | 100 |
| Utilities | 100 | 104 | 100 |
Source: Cost of living index, normalized to US average = 100
Charlottesville, VA Weather
The average high in Charlottesville is 67.6° and the average low is 44.6°.
There are 74.9 days of precipitation each year.
Expect an average of 44.7 inches of precipitation each year with 15.4 inches of snow.
| Stat | Charlottesville |
|---|---|
| Average Annual High | 67.6 |
| Average Annual Low | 44.6 |
| Annual Precipitation Days | 74.9 |
| Average Annual Precipitation | 44.7 |
| Average Annual Snowfall | 15.4 |
Average High
Days of Rain
Source: NOAA climate normals (30-year)
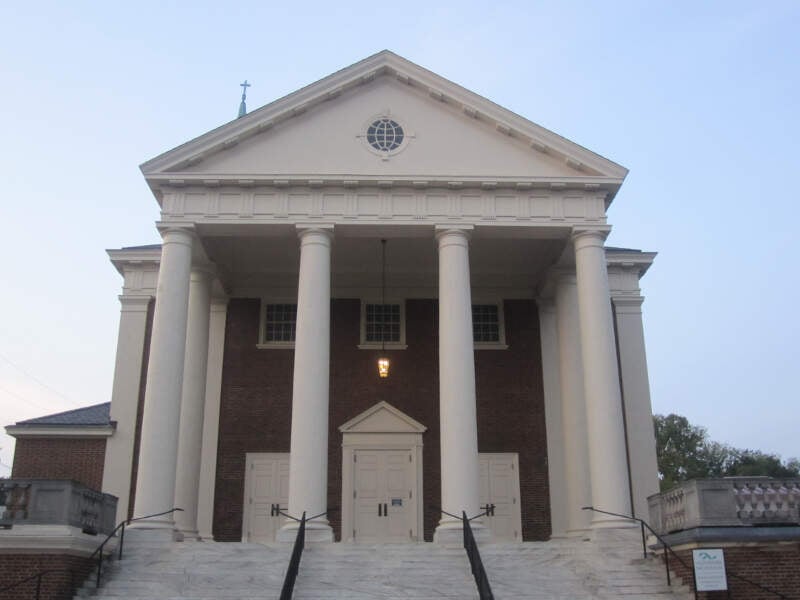
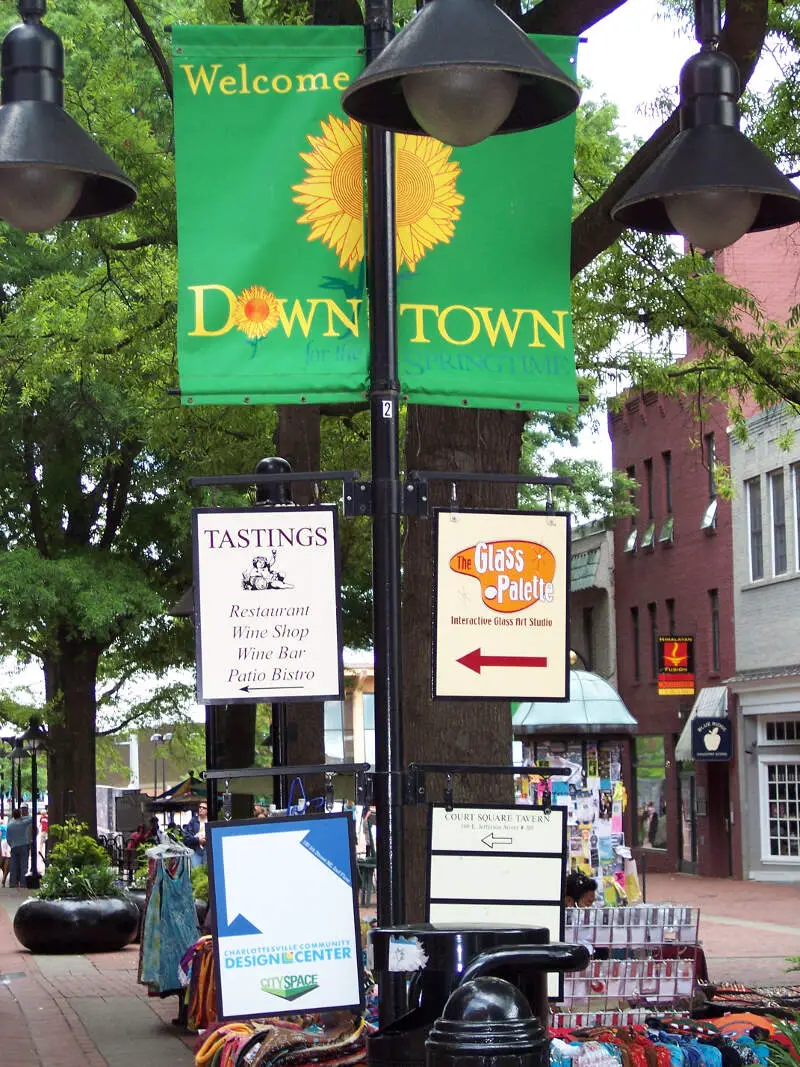
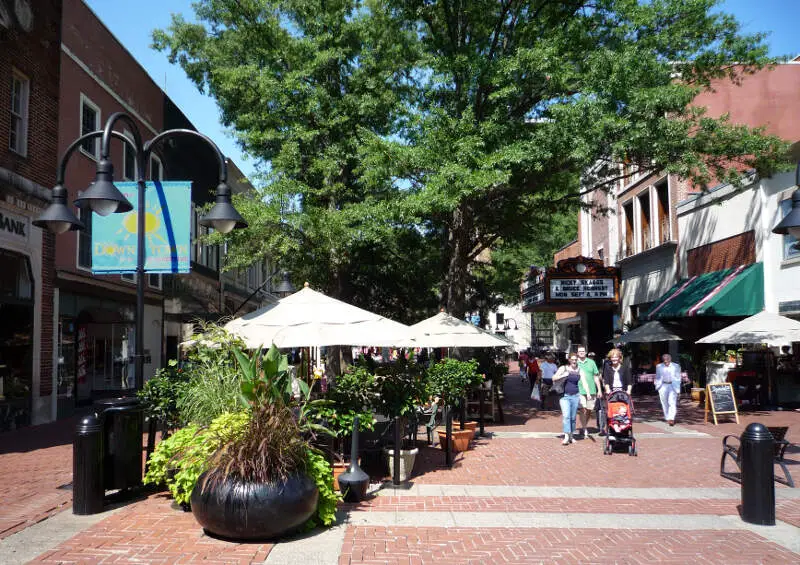
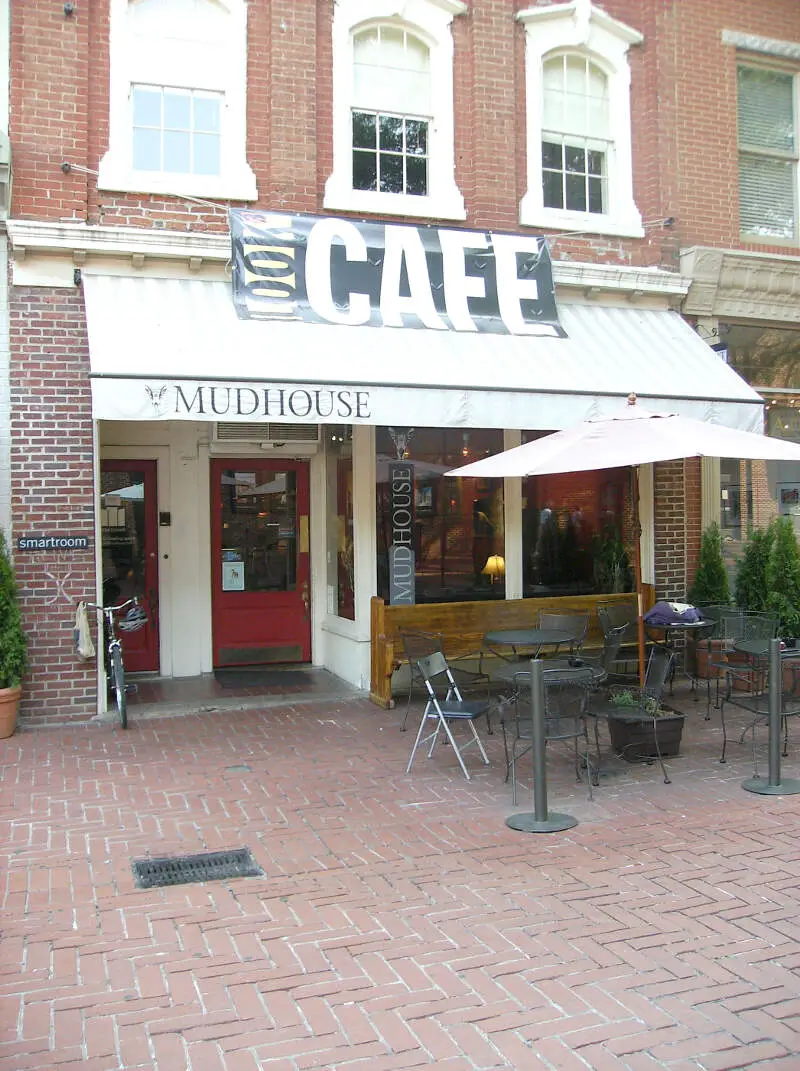
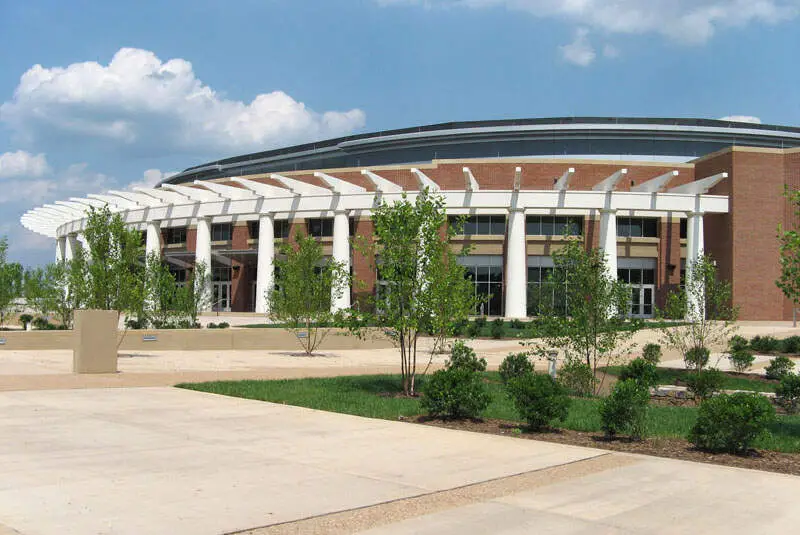
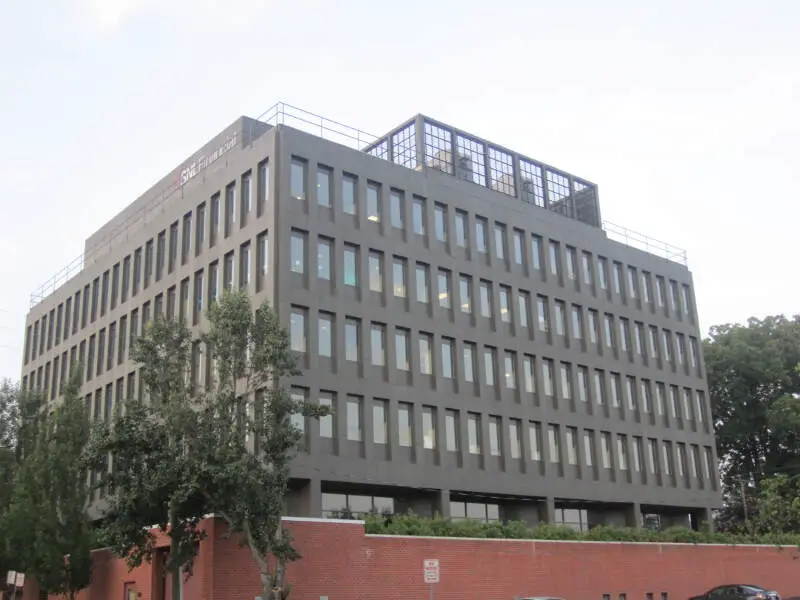
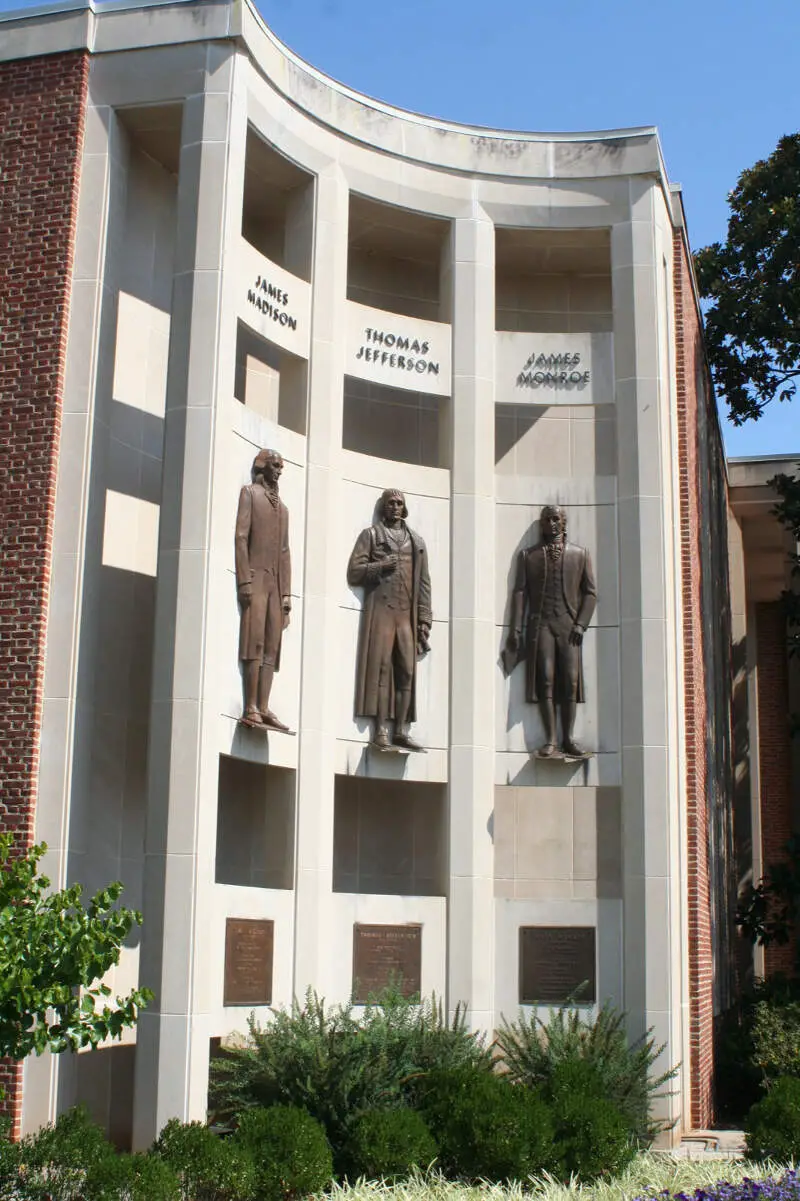
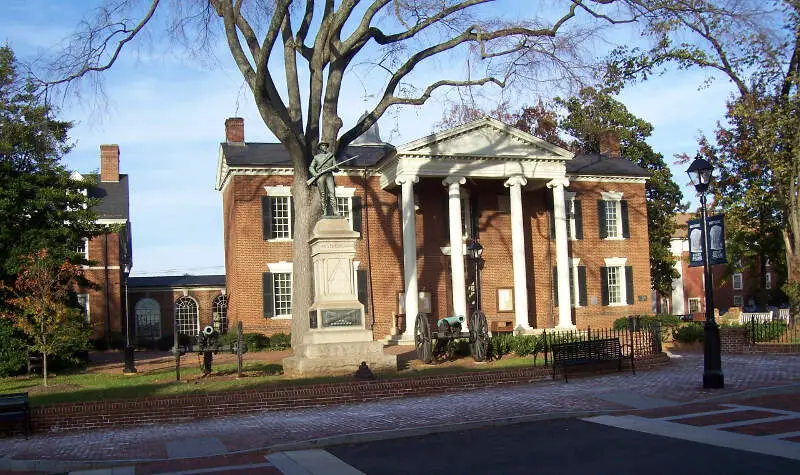
Charlottesville, VA Photos

3 Reviews & Comments About Charlottesville

great town! perfect family area for raising children. The view of the mountains in some places are crazy amazing. great restaurants and the downtown is amazing. its a great city thats not too large
love wild wing cafe! its in a great spot. love that its a great family experience. I love the views in from pantops. its also great location for anywhere youd like to go with mountains and wineries
Charlottesville is a wonderful city. It's not too small and not too big. The people here are very friendly and intelligent. Being a university town, Charlottesville is always lively and has something to do. You can grab a bite to eat at one of the many delicious restaurants, go out dancing, take a hike in the mountains, visit a winery, and do many other things. The schools are great for those living here who have kids. To top it all off, a recent survey rated it as one of the happiest towns in America!
Most of the places to eat have excellent food. Charlottesville is great for wineries and breweries in particular if that strikes your fancy. The only bad thing is that it can sometimes be busy with university football game traffic and the people can be a little pretentious at times.
Charlottesville is an amazing city nestled near the Blue Ridge Mountains in Virginia. It is home to the University of Virginia, one of the top public universities in the country, and the city has so many amazing things to offers for people of all ages.
The foodie scene in Charlottesville is incredible. No visit is complete without a visit to Bellaire Market, which doubles as a gas station. Also, be sure not to miss the hundreds of vineyards that exist throughout the city.
Rankings & Articles For Charlottesville


Locations Around Charlottesville
Map Of Charlottesville, VA
Best Places Around Charlottesville
Lake Monticello, VA
Population 10,662
Lake of the Woods, VA
Population 7,984
Harrisonburg, VA
Population 51,392
Stuarts Draft, VA
Population 11,780
Staunton, VA
Population 25,948
Waynesboro, VA
Population 22,841
Charlottesville Demographics And Statistics
Population over time in Charlottesville
The current population in Charlottesville is 45,437. The population has increased 7.5% from 2010.
| Year | Population | % Change |
|---|---|---|
| 2024 | 45,437 | -0.9% |
| 2023 | 45,863 | -0.9% |
| 2022 | 46,289 | -0.7% |
| 2021 | 46,597 | -1.3% |
| 2020 | 47,217 | 0.3% |
| 2019 | 47,096 | 0.1% |
| 2018 | 47,042 | 1.2% |
| 2017 | 46,487 | 2.1% |
| 2016 | 45,538 | 1.0% |
| 2015 | 45,084 | 1.3% |
| 2014 | 44,505 | 1.9% |
| 2013 | 43,663 | 1.0% |
| 2012 | 43,223 | 1.1% |
| 2011 | 42,758 | 1.2% |
| 2010 | 42,267 | - |
Race / Ethnicity in Charlottesville
See the full breakdown
Charlottesville is:
64.2% White with 29,163 White residents.
15.5% African American with 7,026 African American residents.
0.0% American Indian with 15 American Indian residents.
7.0% Asian with 3,198 Asian residents.
0.0% Hawaiian with 0 Hawaiian residents.
0.7% Other with 302 Other residents.
5.7% Two Or More with 2,601 Two Or More residents.
6.9% Hispanic with 3,132 Hispanic residents.
| Race | Charlottesville | VA | USA |
|---|---|---|---|
| White | 64.2% | 58.4% | 57.4% |
| African American | 15.5% | 18.3% | 11.9% |
| American Indian | 0.0% | 0.1% | 0.5% |
| Asian | 7.0% | 6.9% | 5.9% |
| Hawaiian | 0.0% | 0.1% | 0.2% |
| Other | 0.7% | 0.6% | 0.6% |
| Two Or More | 5.7% | 4.7% | 4.3% |
| Hispanic | 6.9% | 11.0% | 19.3% |
Gender in Charlottesville
See the full breakdown
Charlottesville is 51.9% female with 23,561 female residents.
Charlottesville is 48.1% male with 21,876 male residents.
| Gender | Charlottesville | VA | USA |
|---|---|---|---|
| Female | 51.9% | 50.6% | 50.5% |
| Male | 48.1% | 49.4% | 49.5% |
Highest level of educational attainment in Charlottesville for adults over 25
See the full breakdown
2.0% of adults in Charlottesville completed < 9th grade.
4.0% of adults in Charlottesville completed 9-12th grade.
15.0% of adults in Charlottesville completed high school / ged.
10.0% of adults in Charlottesville completed some college.
6.0% of adults in Charlottesville completed associate's degree.
27.0% of adults in Charlottesville completed bachelor's degree.
21.0% of adults in Charlottesville completed master's degree.
7.0% of adults in Charlottesville completed professional degree.
8.0% of adults in Charlottesville completed doctorate degree.
| Education | Charlottesville | VA | USA |
|---|---|---|---|
| < 9th Grade | 2.0% | 2.0% | 4.0% |
| 9-12th Grade | 4.0% | 5.0% | 6.0% |
| High School / GED | 15.0% | 24.0% | 26.0% |
| Some College | 10.0% | 18.0% | 19.0% |
| Associate's Degree | 6.0% | 8.0% | 9.0% |
| Bachelor's Degree | 27.0% | 24.0% | 22.0% |
| Master's Degree | 21.0% | 14.0% | 10.0% |
| Professional Degree | 7.0% | 3.0% | 2.0% |
| Doctorate Degree | 8.0% | 2.0% | 2.0% |
Household Income For Charlottesville, Virginia
See the full breakdown
8.2% of households in Charlottesville earn Less than $10,000.
4.1% of households in Charlottesville earn $10,000 to $14,999.
7.3% of households in Charlottesville earn $15,000 to $24,999.
6.3% of households in Charlottesville earn $25,000 to $34,999.
10.3% of households in Charlottesville earn $35,000 to $49,999.
13.8% of households in Charlottesville earn $50,000 to $74,999.
12.0% of households in Charlottesville earn $75,000 to $99,999.
13.1% of households in Charlottesville earn $100,000 to $149,999.
9.6% of households in Charlottesville earn $150,000 to $199,999.
15.1% of households in Charlottesville earn $200,000 or more.
| Income | Charlottesville | VA | USA |
|---|---|---|---|
| Less than $10,000 | 8.2% | 4.2% | 5.0% |
| $10,000 to $14,999 | 4.1% | 2.7% | 3.4% |
| $15,000 to $24,999 | 7.3% | 5.2% | 6.3% |
| $25,000 to $34,999 | 6.3% | 5.7% | 6.6% |
| $35,000 to $49,999 | 10.3% | 8.8% | 10.1% |
| $50,000 to $74,999 | 13.8% | 14.3% | 15.5% |
| $75,000 to $99,999 | 12.0% | 12.1% | 12.6% |
| $100,000 to $149,999 | 13.1% | 18.1% | 17.5% |
| $150,000 to $199,999 | 9.6% | 11.1% | 9.6% |
| $200,000 or more | 15.1% | 17.7% | 13.4% |
Source: U.S. Census ACS 5-year estimates (2024)


