Staunton SnackAbility
Overall SnackAbility
Crime in Staunton summary. We use data from the FBI to determine the crime rates in Staunton. Key points include:
There were 431 total crimes in Staunton in the last reporting year.
The overall crime rate per 100,000 people in Staunton is 1,648.1 / 100k people.
The violent crime rate per 100,000 people in Staunton is 141.5 / 100k people.
The property crime rate per 100,000 people in Staunton is 1,506.6 / 100k people.
Overall, crime in Staunton is -22.23% below the national average.
Total Crimes
Below National Average
Crime In Staunton Comparison Table
| Statistic | Count Raw |
Staunton / 100k People |
Virginia / 100k People |
National / 100k People |
|---|---|---|---|---|
| Total Crimes Per 100K | 431 | 1,648.1 | 1,787.6 | 2,119.2 |
| Violent Crime | 37 | 141.5 | 217.9 | 359.0 |
| Murder | 2 | 7.6 | 4.8 | 5.0 |
| Robbery | 2 | 7.6 | 33.1 | 61.0 |
| Aggravated Assault | 20 | 76.5 | 152.2 | 256.0 |
| Property Crime | 394 | 1,506.6 | 1,569.7 | 1,760.0 |
| Burglary | 27 | 103.2 | 108.7 | 229.0 |
| Larceny | 344 | 1,315.4 | 1,315.9 | 1,272.0 |
| Car Theft | 23 | 88.0 | 145.1 | 259.0 |
Source: FBI Uniform Crime Reporting (2024)
Cost of living in Staunton summary. We use data on the cost of living to determine how expensive it is to live in Staunton. Real estate prices drive most of the variance in cost of living around Virginia. Key points include:
The cost of living in Staunton is 102 with 100 being average.
The cost of living in Staunton is 1.0x higher than the national average.
The median home value in Staunton is $308,028.
The median income in Staunton is $65,581.
Staunton's Overall Cost Of Living
Higher Than The National Average
Cost Of Living In Staunton Comparison Table
| Living Expense | Staunton | Virginia | National Average |
|---|---|---|---|
| Overall | 102 | 112 | 100 |
| Services | 103 | 103 | 100 |
| Groceries | 105 | 104 | 100 |
| Health | 92 | 131 | 100 |
| Housing | 100 | 105 | 100 |
| Transportation | 107 | 105 | 100 |
| Utilities | 108 | 104 | 100 |
Source: Cost of living index, normalized to US average = 100
Staunton, VA Weather
The average high in Staunton is 65.2° and the average low is 41.5°.
There are 77.9 days of precipitation each year.
Expect an average of 38.7 inches of precipitation each year with 22.5 inches of snow.
| Stat | Staunton |
|---|---|
| Average Annual High | 65.2 |
| Average Annual Low | 41.5 |
| Annual Precipitation Days | 77.9 |
| Average Annual Precipitation | 38.7 |
| Average Annual Snowfall | 22.5 |
Average High
Days of Rain
Source: NOAA climate normals (30-year)
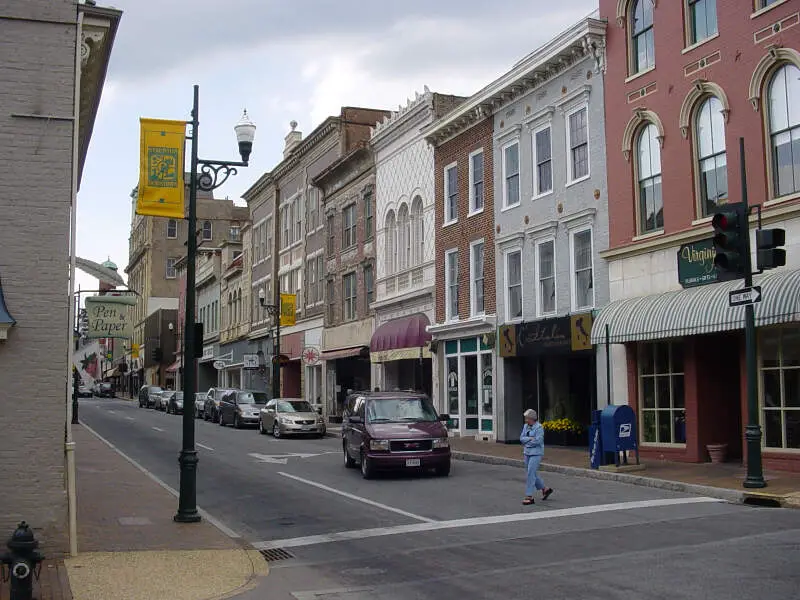
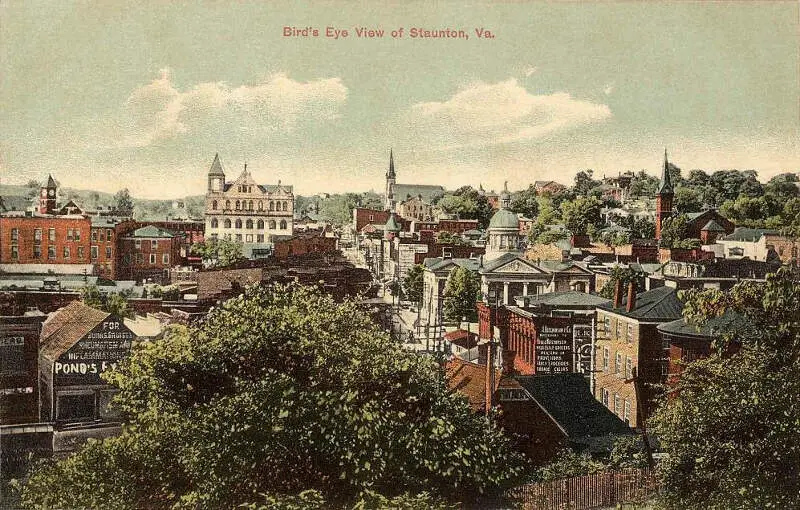
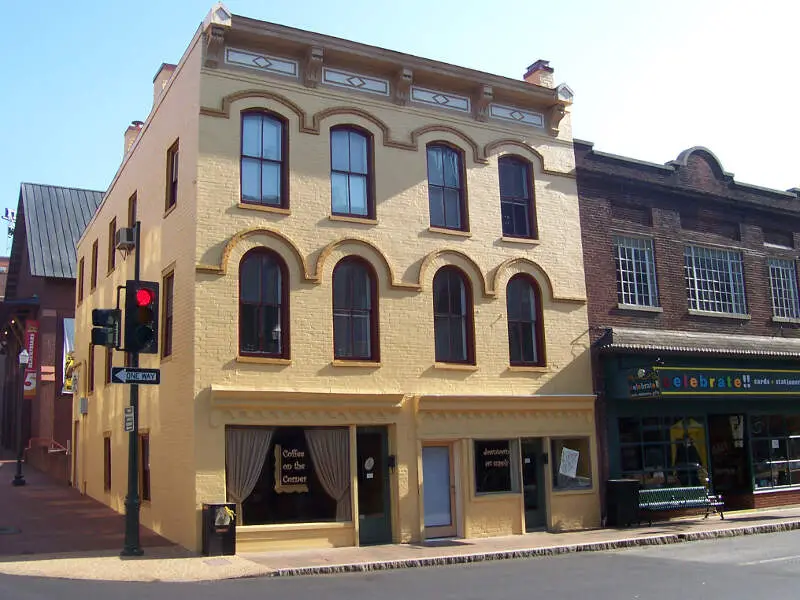
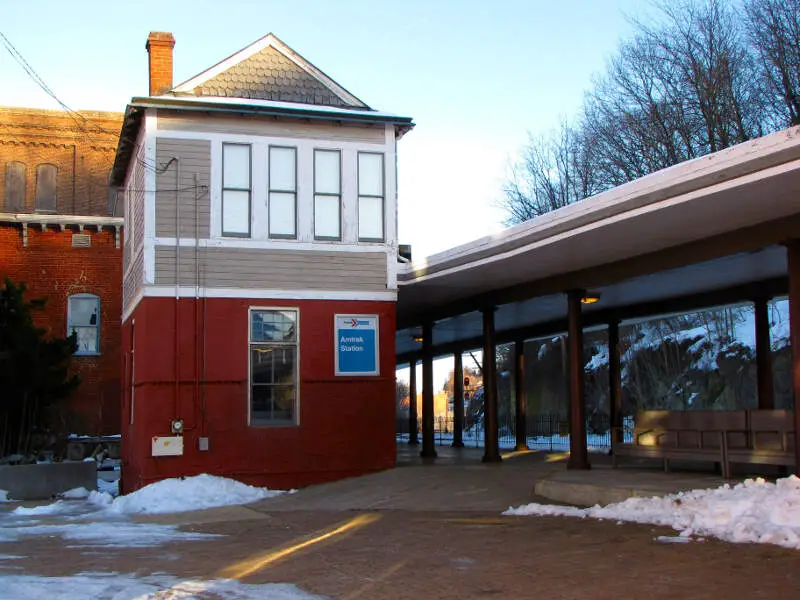
Staunton, VA Photos

Rankings & Articles For Staunton


Locations Around Staunton
Map Of Staunton, VA
Best Places Around Staunton
Charlottesville, VA
Population 45,437
Lake Monticello, VA
Population 10,662
Lexington, VA
Population 7,525
Harrisonburg, VA
Population 51,392
Stuarts Draft, VA
Population 11,780
Waynesboro, VA
Population 22,841
Buena Vista, VA
Population 6,593
Madison Heights, VA
Population 10,266
Staunton Demographics And Statistics
Population over time in Staunton
The current population in Staunton is 25,948. The population has increased 9.0% from 2010.
| Year | Population | % Change |
|---|---|---|
| 2024 | 25,948 | 0.7% |
| 2023 | 25,765 | 0.7% |
| 2022 | 25,581 | 0.9% |
| 2021 | 25,358 | 2.8% |
| 2020 | 24,660 | 0.9% |
| 2019 | 24,432 | -0.1% |
| 2018 | 24,452 | 0.7% |
| 2017 | 24,273 | 0.2% |
| 2016 | 24,234 | 0.2% |
| 2015 | 24,193 | 0.3% |
| 2014 | 24,132 | 0.6% |
| 2013 | 23,989 | 0.3% |
| 2012 | 23,906 | 0.3% |
| 2011 | 23,835 | 0.1% |
| 2010 | 23,806 | - |
Race / Ethnicity in Staunton
See the full breakdown
Staunton is:
78.3% White with 20,330 White residents.
10.3% African American with 2,662 African American residents.
0.1% American Indian with 28 American Indian residents.
1.4% Asian with 361 Asian residents.
0.0% Hawaiian with 8 Hawaiian residents.
0.2% Other with 60 Other residents.
4.9% Two Or More with 1,266 Two Or More residents.
4.8% Hispanic with 1,233 Hispanic residents.
| Race | Staunton | VA | USA |
|---|---|---|---|
| White | 78.3% | 58.4% | 57.4% |
| African American | 10.3% | 18.3% | 11.9% |
| American Indian | 0.1% | 0.1% | 0.5% |
| Asian | 1.4% | 6.9% | 5.9% |
| Hawaiian | 0.0% | 0.1% | 0.2% |
| Other | 0.2% | 0.6% | 0.6% |
| Two Or More | 4.9% | 4.7% | 4.3% |
| Hispanic | 4.8% | 11.0% | 19.3% |
Gender in Staunton
See the full breakdown
Staunton is 54.2% female with 14,051 female residents.
Staunton is 45.8% male with 11,897 male residents.
| Gender | Staunton | VA | USA |
|---|---|---|---|
| Female | 54.2% | 50.6% | 50.5% |
| Male | 45.8% | 49.4% | 49.5% |
Highest level of educational attainment in Staunton for adults over 25
See the full breakdown
3.0% of adults in Staunton completed < 9th grade.
4.0% of adults in Staunton completed 9-12th grade.
28.0% of adults in Staunton completed high school / ged.
21.0% of adults in Staunton completed some college.
7.0% of adults in Staunton completed associate's degree.
21.0% of adults in Staunton completed bachelor's degree.
12.0% of adults in Staunton completed master's degree.
2.0% of adults in Staunton completed professional degree.
2.0% of adults in Staunton completed doctorate degree.
| Education | Staunton | VA | USA |
|---|---|---|---|
| < 9th Grade | 3.0% | 2.0% | 4.0% |
| 9-12th Grade | 4.0% | 5.0% | 6.0% |
| High School / GED | 28.0% | 24.0% | 26.0% |
| Some College | 21.0% | 18.0% | 19.0% |
| Associate's Degree | 7.0% | 8.0% | 9.0% |
| Bachelor's Degree | 21.0% | 24.0% | 22.0% |
| Master's Degree | 12.0% | 14.0% | 10.0% |
| Professional Degree | 2.0% | 3.0% | 2.0% |
| Doctorate Degree | 2.0% | 2.0% | 2.0% |
Household Income For Staunton, Virginia
See the full breakdown
4.5% of households in Staunton earn Less than $10,000.
5.3% of households in Staunton earn $10,000 to $14,999.
7.4% of households in Staunton earn $15,000 to $24,999.
8.4% of households in Staunton earn $25,000 to $34,999.
13.4% of households in Staunton earn $35,000 to $49,999.
17.3% of households in Staunton earn $50,000 to $74,999.
14.2% of households in Staunton earn $75,000 to $99,999.
18.0% of households in Staunton earn $100,000 to $149,999.
7.0% of households in Staunton earn $150,000 to $199,999.
4.5% of households in Staunton earn $200,000 or more.
| Income | Staunton | VA | USA |
|---|---|---|---|
| Less than $10,000 | 4.5% | 4.2% | 5.0% |
| $10,000 to $14,999 | 5.3% | 2.7% | 3.4% |
| $15,000 to $24,999 | 7.4% | 5.2% | 6.3% |
| $25,000 to $34,999 | 8.4% | 5.7% | 6.6% |
| $35,000 to $49,999 | 13.4% | 8.8% | 10.1% |
| $50,000 to $74,999 | 17.3% | 14.3% | 15.5% |
| $75,000 to $99,999 | 14.2% | 12.1% | 12.6% |
| $100,000 to $149,999 | 18.0% | 18.1% | 17.5% |
| $150,000 to $199,999 | 7.0% | 11.1% | 9.6% |
| $200,000 or more | 4.5% | 17.7% | 13.4% |
Source: U.S. Census ACS 5-year estimates (2024)


