Smithfield SnackAbility
Overall SnackAbility
Crime in Smithfield summary. We use data from the FBI to determine the crime rates in Smithfield. Key points include:
There were 117 total crimes in Smithfield in the last reporting year.
The overall crime rate per 100,000 people in Smithfield is 1,280.5 / 100k people.
The violent crime rate per 100,000 people in Smithfield is 175.1 / 100k people.
The property crime rate per 100,000 people in Smithfield is 1,105.4 / 100k people.
Overall, crime in Smithfield is -39.58% below the national average.
Total Crimes
Below National Average
Crime In Smithfield Comparison Table
| Statistic | Count Raw |
Smithfield / 100k People |
Virginia / 100k People |
National / 100k People |
|---|---|---|---|---|
| Total Crimes Per 100K | 117 | 1,280.5 | 1,787.6 | 2,119.2 |
| Violent Crime | 16 | 175.1 | 217.9 | 359.0 |
| Murder | 0 | 0.0 | 4.8 | 5.0 |
| Robbery | 2 | 21.9 | 33.1 | 61.0 |
| Aggravated Assault | 13 | 142.3 | 152.2 | 256.0 |
| Property Crime | 101 | 1,105.4 | 1,569.7 | 1,760.0 |
| Burglary | 9 | 98.5 | 108.7 | 229.0 |
| Larceny | 86 | 941.2 | 1,315.9 | 1,272.0 |
| Car Theft | 6 | 65.7 | 145.1 | 259.0 |
Source: FBI Uniform Crime Reporting (2024)
Cost of living in Smithfield summary. We use data on the cost of living to determine how expensive it is to live in Smithfield. Real estate prices drive most of the variance in cost of living around Virginia. Key points include:
The cost of living in Smithfield is 116 with 100 being average.
The cost of living in Smithfield is 1.2x higher than the national average.
The median home value in Smithfield is $393,349.
The median income in Smithfield is $113,158.
Smithfield's Overall Cost Of Living
Higher Than The National Average
Cost Of Living In Smithfield Comparison Table
| Living Expense | Smithfield | Virginia | National Average |
|---|---|---|---|
| Overall | 116 | 112 | 100 |
| Services | 104 | 103 | 100 |
| Groceries | 105 | 104 | 100 |
| Health | 146 | 131 | 100 |
| Housing | 107 | 105 | 100 |
| Transportation | 109 | 105 | 100 |
| Utilities | 106 | 104 | 100 |
Source: Cost of living index, normalized to US average = 100
Smithfield, VA Weather
The average high in Smithfield is 69.1° and the average low is 50.9°.
There are 77.8 days of precipitation each year.
Expect an average of 47.0 inches of precipitation each year with 5.0 inches of snow.
| Stat | Smithfield |
|---|---|
| Average Annual High | 69.1 |
| Average Annual Low | 50.9 |
| Annual Precipitation Days | 77.8 |
| Average Annual Precipitation | 47.0 |
| Average Annual Snowfall | 5.0 |
Average High
Days of Rain
Source: NOAA climate normals (30-year)
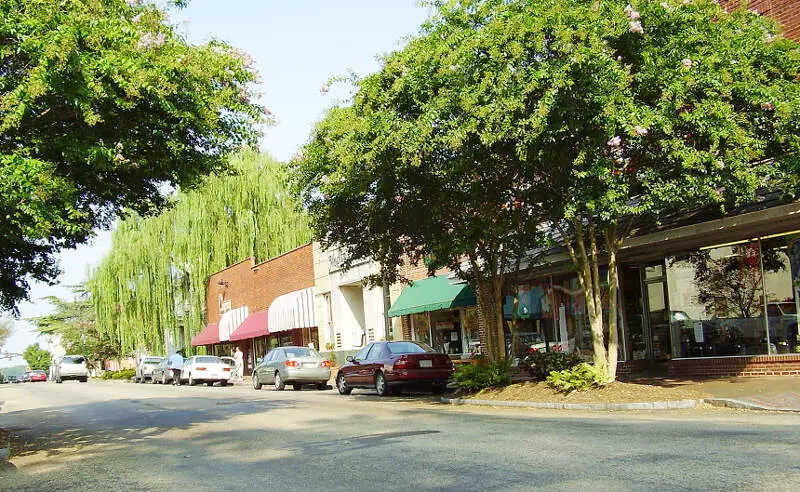
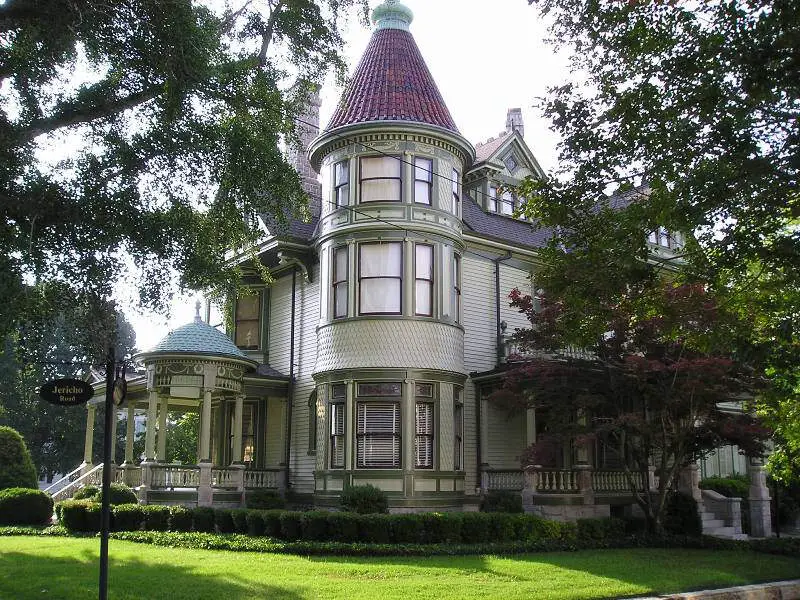
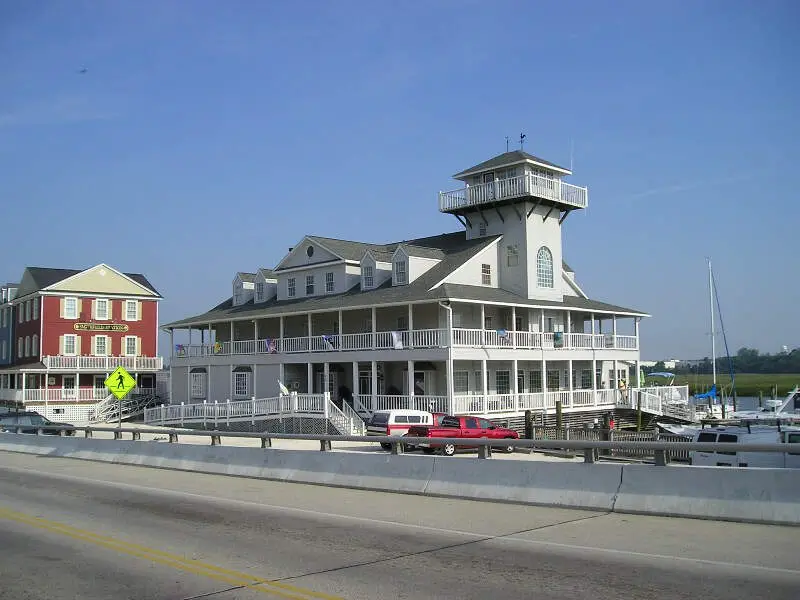
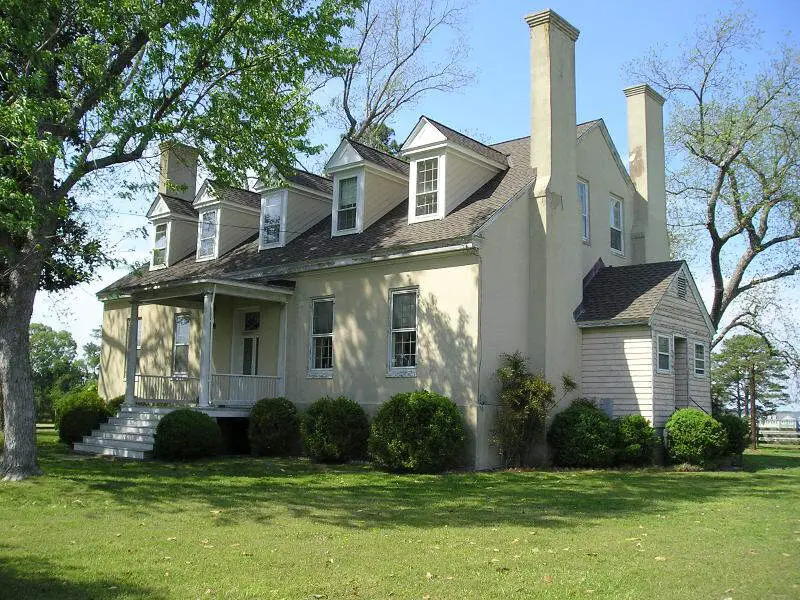
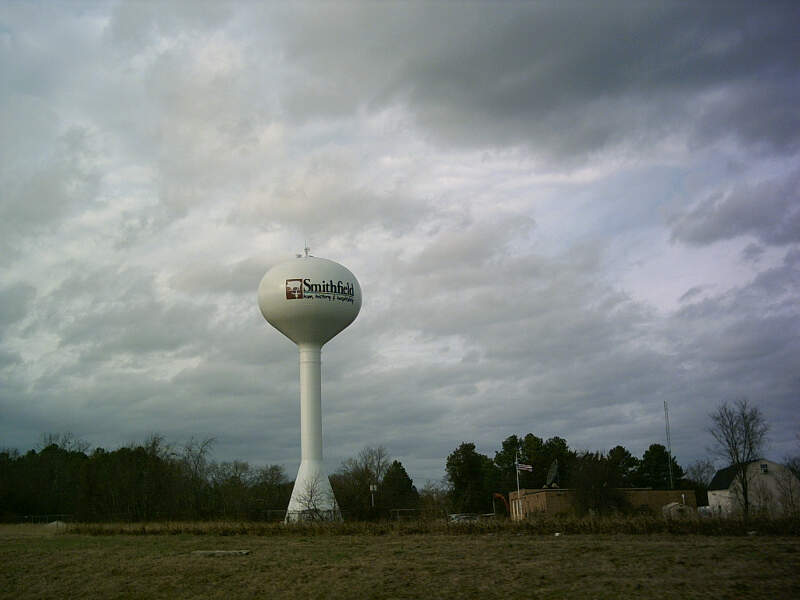
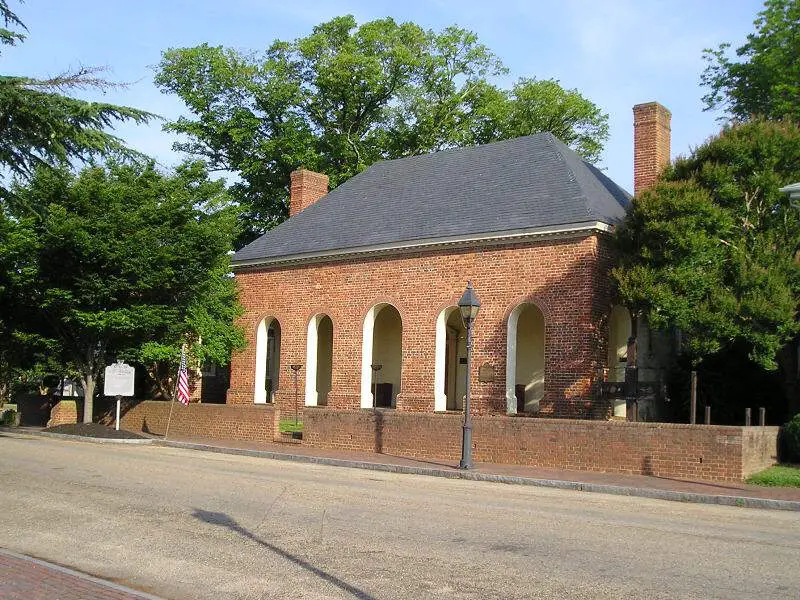
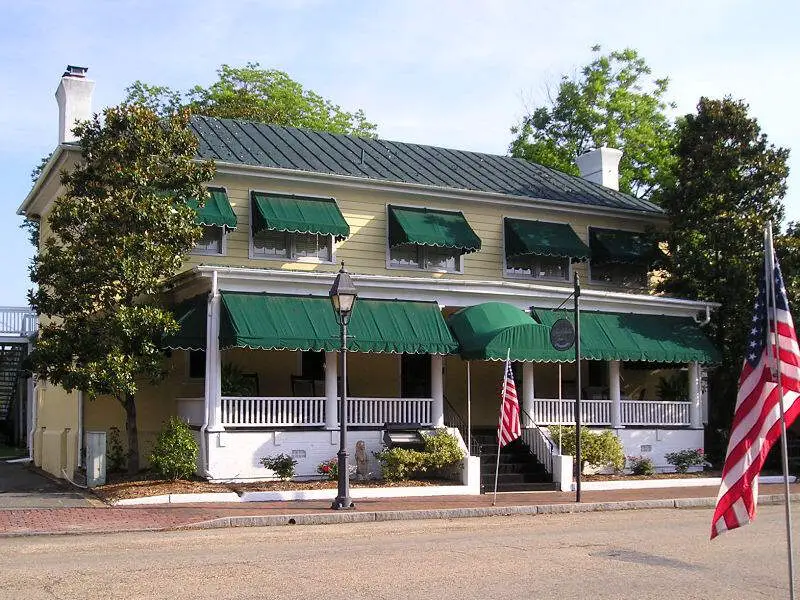
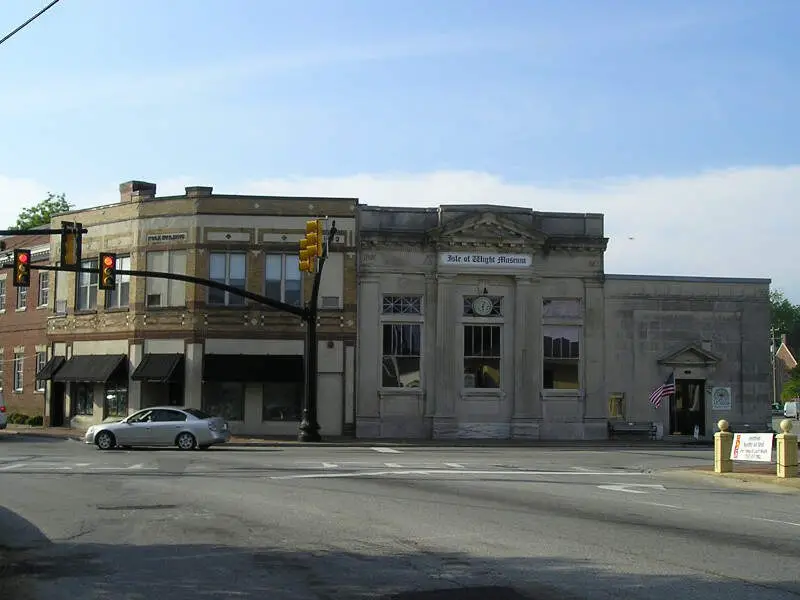
Smithfield, VA Photos

Rankings & Articles For Smithfield


Locations Around Smithfield
Map Of Smithfield, VA
Best Places Around Smithfield
Poquoson, VA
Population 12,639
Virginia Beach, VA
Population 456,349
Gloucester Point, VA
Population 11,109
Chesapeake, VA
Population 252,583
Colonial Heights, VA
Population 18,352
Suffolk, VA
Population 98,796
Hampton, VA
Population 137,557
Newport News, VA
Population 184,216
Norfolk, VA
Population 233,596
Franklin, VA
Population 8,250
Smithfield Demographics And Statistics
Population over time in Smithfield
The current population in Smithfield is 8,834. The population has increased 12.3% from 2010.
| Year | Population | % Change |
|---|---|---|
| 2024 | 8,834 | 1.2% |
| 2023 | 8,729 | 1.2% |
| 2022 | 8,625 | 1.3% |
| 2021 | 8,513 | 0.2% |
| 2020 | 8,492 | 1.5% |
| 2019 | 8,367 | 0.5% |
| 2018 | 8,324 | 0.8% |
| 2017 | 8,262 | -0.5% |
| 2016 | 8,304 | 0.9% |
| 2015 | 8,233 | 0.9% |
| 2014 | 8,159 | 0.4% |
| 2013 | 8,126 | 0.8% |
| 2012 | 8,059 | 0.8% |
| 2011 | 7,997 | 1.6% |
| 2010 | 7,869 | - |
Race / Ethnicity in Smithfield
See the full breakdown
Smithfield is:
74.4% White with 6,574 White residents.
17.6% African American with 1,557 African American residents.
0.1% American Indian with 5 American Indian residents.
0.3% Asian with 29 Asian residents.
1.1% Hawaiian with 97 Hawaiian residents.
1.1% Other with 97 Other residents.
3.3% Two Or More with 292 Two Or More residents.
2.1% Hispanic with 183 Hispanic residents.
| Race | Smithfield | VA | USA |
|---|---|---|---|
| White | 74.4% | 58.4% | 57.4% |
| African American | 17.6% | 18.3% | 11.9% |
| American Indian | 0.1% | 0.1% | 0.5% |
| Asian | 0.3% | 6.9% | 5.9% |
| Hawaiian | 1.1% | 0.1% | 0.2% |
| Other | 1.1% | 0.6% | 0.6% |
| Two Or More | 3.3% | 4.7% | 4.3% |
| Hispanic | 2.1% | 11.0% | 19.3% |
Gender in Smithfield
See the full breakdown
Smithfield is 49.9% female with 4,407 female residents.
Smithfield is 50.1% male with 4,427 male residents.
| Gender | Smithfield | VA | USA |
|---|---|---|---|
| Female | 49.9% | 50.6% | 50.5% |
| Male | 50.1% | 49.4% | 49.5% |
Highest level of educational attainment in Smithfield for adults over 25
See the full breakdown
2.0% of adults in Smithfield completed < 9th grade.
3.0% of adults in Smithfield completed 9-12th grade.
29.0% of adults in Smithfield completed high school / ged.
22.0% of adults in Smithfield completed some college.
8.0% of adults in Smithfield completed associate's degree.
23.0% of adults in Smithfield completed bachelor's degree.
11.0% of adults in Smithfield completed master's degree.
1.0% of adults in Smithfield completed professional degree.
1.0% of adults in Smithfield completed doctorate degree.
| Education | Smithfield | VA | USA |
|---|---|---|---|
| < 9th Grade | 2.0% | 2.0% | 4.0% |
| 9-12th Grade | 3.0% | 5.0% | 6.0% |
| High School / GED | 29.0% | 24.0% | 26.0% |
| Some College | 22.0% | 18.0% | 19.0% |
| Associate's Degree | 8.0% | 8.0% | 9.0% |
| Bachelor's Degree | 23.0% | 24.0% | 22.0% |
| Master's Degree | 11.0% | 14.0% | 10.0% |
| Professional Degree | 1.0% | 3.0% | 2.0% |
| Doctorate Degree | 1.0% | 2.0% | 2.0% |
Household Income For Smithfield, Virginia
See the full breakdown
2.8% of households in Smithfield earn Less than $10,000.
3.3% of households in Smithfield earn $10,000 to $14,999.
4.1% of households in Smithfield earn $15,000 to $24,999.
3.9% of households in Smithfield earn $25,000 to $34,999.
10.2% of households in Smithfield earn $35,000 to $49,999.
10.6% of households in Smithfield earn $50,000 to $74,999.
9.7% of households in Smithfield earn $75,000 to $99,999.
15.8% of households in Smithfield earn $100,000 to $149,999.
23.2% of households in Smithfield earn $150,000 to $199,999.
16.3% of households in Smithfield earn $200,000 or more.
| Income | Smithfield | VA | USA |
|---|---|---|---|
| Less than $10,000 | 2.8% | 4.2% | 5.0% |
| $10,000 to $14,999 | 3.3% | 2.7% | 3.4% |
| $15,000 to $24,999 | 4.1% | 5.2% | 6.3% |
| $25,000 to $34,999 | 3.9% | 5.7% | 6.6% |
| $35,000 to $49,999 | 10.2% | 8.8% | 10.1% |
| $50,000 to $74,999 | 10.6% | 14.3% | 15.5% |
| $75,000 to $99,999 | 9.7% | 12.1% | 12.6% |
| $100,000 to $149,999 | 15.8% | 18.1% | 17.5% |
| $150,000 to $199,999 | 23.2% | 11.1% | 9.6% |
| $200,000 or more | 16.3% | 17.7% | 13.4% |
Source: U.S. Census ACS 5-year estimates (2024)


