Compare Virginia Beach to…
Virginia Beach SnackAbility
Overall SnackAbility
Crime in Virginia Beach summary. We use data from the FBI to determine the crime rates in Virginia Beach. Key points include:
There were 7,884 total crimes in Virginia Beach in the last reporting year.
The overall crime rate per 100,000 people in Virginia Beach is 1,732.2 / 100k people.
The violent crime rate per 100,000 people in Virginia Beach is 92.3 / 100k people.
The property crime rate per 100,000 people in Virginia Beach is 1,639.9 / 100k people.
Overall, crime in Virginia Beach is -18.26% below the national average.
Total Crimes
Below National Average
Crime In Virginia Beach Comparison Table
| Statistic | Count Raw |
Virginia Beach / 100k People |
Virginia / 100k People |
National / 100k People |
|---|---|---|---|---|
| Total Crimes Per 100K | 7,884 | 1,732.2 | 1,787.6 | 2,119.2 |
| Violent Crime | 420 | 92.3 | 217.9 | 359.0 |
| Murder | 13 | 2.9 | 4.8 | 5.0 |
| Robbery | 144 | 31.6 | 33.1 | 61.0 |
| Aggravated Assault | 179 | 39.3 | 152.2 | 256.0 |
| Property Crime | 7,464 | 1,639.9 | 1,569.7 | 1,760.0 |
| Burglary | 382 | 83.9 | 108.7 | 229.0 |
| Larceny | 6,585 | 1,446.8 | 1,315.9 | 1,272.0 |
| Car Theft | 497 | 109.2 | 145.1 | 259.0 |
Source: FBI Uniform Crime Reporting (2024)
Cost of living in Virginia Beach summary. We use data on the cost of living to determine how expensive it is to live in Virginia Beach. Real estate prices drive most of the variance in cost of living around Virginia. Key points include:
The cost of living in Virginia Beach is 118 with 100 being average.
The cost of living in Virginia Beach is 1.2x higher than the national average.
The median home value in Virginia Beach is $427,031.
The median income in Virginia Beach is $92,968.
Virginia Beach's Overall Cost Of Living
Higher Than The National Average
Cost Of Living In Virginia Beach Comparison Table
| Living Expense | Virginia Beach | Virginia | National Average |
|---|---|---|---|
| Overall | 118 | 112 | 100 |
| Services | 104 | 103 | 100 |
| Groceries | 109 | 104 | 100 |
| Health | 150 | 131 | 100 |
| Housing | 109 | 105 | 100 |
| Transportation | 103 | 105 | 100 |
| Utilities | 104 | 104 | 100 |
Source: Cost of living index, normalized to US average = 100
Virginia Beach, VA Weather
The average high in Virginia Beach is 68.5° and the average low is 52.2°.
There are 75.2 days of precipitation each year.
Expect an average of 44.8 inches of precipitation each year with 6.1 inches of snow.
| Stat | Virginia Beach |
|---|---|
| Average Annual High | 68.5 |
| Average Annual Low | 52.2 |
| Annual Precipitation Days | 75.2 |
| Average Annual Precipitation | 44.8 |
| Average Annual Snowfall | 6.1 |
Average High
Days of Rain
Source: NOAA climate normals (30-year)
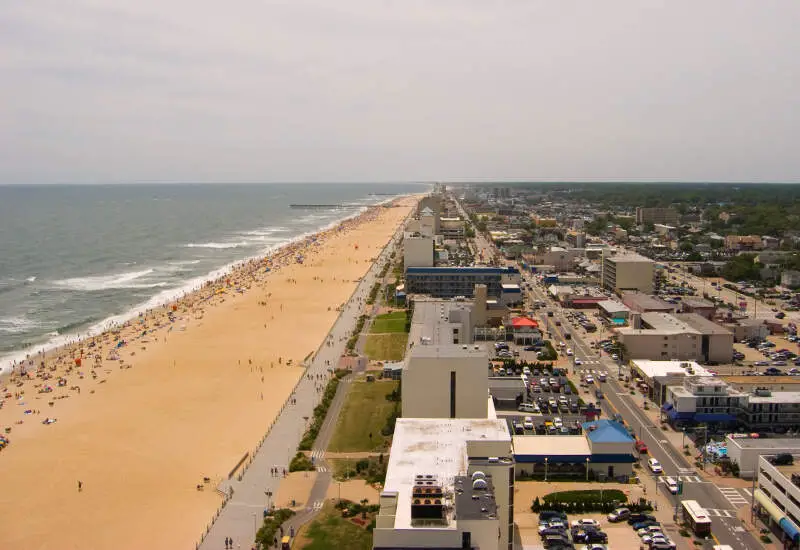
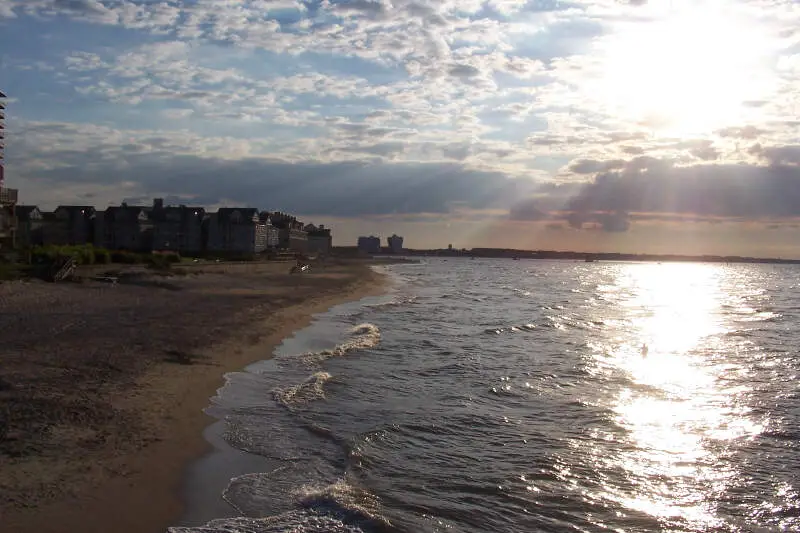
Virginia Beach, VA Photos


2 Reviews & Comments About Virginia Beach

The positives: This place has a ton of things to do for both adults and children, making it very family friendly and oriented. You'll never get bored.
Cons: This is a tourist town, and some of the fun things, such as the boardwalk, are almost impossible for locals to access during the summer months. Also, the influx of population also brings along a higher level of crime during these months.
The restaurants here are plentiful and phenomenal. However, the people aren't always friendly.
Crime is low, schools are great, there is always plenty to do and there are miles and miles of beaches!
My favorite place is Ocean Eddie's on the Virginia Beach Pier. Great food at reasonable prices!
Rankings & Articles For Virginia Beach


Locations Around Virginia Beach
Map Of Virginia Beach, VA
Best Places Around Virginia Beach
Poquoson, VA
Population 12,639
Smithfield, VA
Population 8,834
Gloucester Point, VA
Population 11,109
Chesapeake, VA
Population 252,583
Suffolk, VA
Population 98,796
Hampton, VA
Population 137,557
Newport News, VA
Population 184,216
Norfolk, VA
Population 233,596
Elizabeth, NJ
Population 137,302
Portsmouth, VA
Population 97,190
Virginia Beach Demographics And Statistics
Population over time in Virginia Beach
The current population in Virginia Beach is 456,349. The population has increased 4.7% from 2010.
| Year | Population | % Change |
|---|---|---|
| 2024 | 456,349 | -0.2% |
| 2023 | 457,066 | -0.2% |
| 2022 | 457,900 | 0.1% |
| 2021 | 457,658 | 1.5% |
| 2020 | 450,882 | 0.2% |
| 2019 | 450,201 | 0.0% |
| 2018 | 450,135 | 0.0% |
| 2017 | 450,057 | 0.1% |
| 2016 | 449,733 | 0.3% |
| 2015 | 448,290 | 0.6% |
| 2014 | 445,623 | 0.8% |
| 2013 | 442,151 | 0.6% |
| 2012 | 439,528 | 0.6% |
| 2011 | 436,979 | 0.2% |
| 2010 | 435,996 | - |
Race / Ethnicity in Virginia Beach
See the full breakdown
Virginia Beach is:
58.8% White with 268,555 White residents.
18.2% African American with 82,972 African American residents.
0.1% American Indian with 502 American Indian residents.
7.1% Asian with 32,184 Asian residents.
0.1% Hawaiian with 454 Hawaiian residents.
0.6% Other with 2,908 Other residents.
6.0% Two Or More with 27,262 Two Or More residents.
9.1% Hispanic with 41,512 Hispanic residents.
| Race | Virginia Beach | VA | USA |
|---|---|---|---|
| White | 58.8% | 58.4% | 57.4% |
| African American | 18.2% | 18.3% | 11.9% |
| American Indian | 0.1% | 0.1% | 0.5% |
| Asian | 7.1% | 6.9% | 5.9% |
| Hawaiian | 0.1% | 0.1% | 0.2% |
| Other | 0.6% | 0.6% | 0.6% |
| Two Or More | 6.0% | 4.7% | 4.3% |
| Hispanic | 9.1% | 11.0% | 19.3% |
Gender in Virginia Beach
See the full breakdown
Virginia Beach is 51.0% female with 232,631 female residents.
Virginia Beach is 49.0% male with 223,717 male residents.
| Gender | Virginia Beach | VA | USA |
|---|---|---|---|
| Female | 51.0% | 50.6% | 50.5% |
| Male | 49.0% | 49.4% | 49.5% |
Highest level of educational attainment in Virginia Beach for adults over 25
See the full breakdown
2.0% of adults in Virginia Beach completed < 9th grade.
3.0% of adults in Virginia Beach completed 9-12th grade.
22.0% of adults in Virginia Beach completed high school / ged.
22.0% of adults in Virginia Beach completed some college.
10.0% of adults in Virginia Beach completed associate's degree.
25.0% of adults in Virginia Beach completed bachelor's degree.
12.0% of adults in Virginia Beach completed master's degree.
2.0% of adults in Virginia Beach completed professional degree.
2.0% of adults in Virginia Beach completed doctorate degree.
| Education | Virginia Beach | VA | USA |
|---|---|---|---|
| < 9th Grade | 2.0% | 2.0% | 4.0% |
| 9-12th Grade | 3.0% | 5.0% | 6.0% |
| High School / GED | 22.0% | 24.0% | 26.0% |
| Some College | 22.0% | 18.0% | 19.0% |
| Associate's Degree | 10.0% | 8.0% | 9.0% |
| Bachelor's Degree | 25.0% | 24.0% | 22.0% |
| Master's Degree | 12.0% | 14.0% | 10.0% |
| Professional Degree | 2.0% | 3.0% | 2.0% |
| Doctorate Degree | 2.0% | 2.0% | 2.0% |
Household Income For Virginia Beach, Virginia
See the full breakdown
3.7% of households in Virginia Beach earn Less than $10,000.
2.2% of households in Virginia Beach earn $10,000 to $14,999.
3.7% of households in Virginia Beach earn $15,000 to $24,999.
4.9% of households in Virginia Beach earn $25,000 to $34,999.
8.1% of households in Virginia Beach earn $35,000 to $49,999.
17.9% of households in Virginia Beach earn $50,000 to $74,999.
13.0% of households in Virginia Beach earn $75,000 to $99,999.
21.3% of households in Virginia Beach earn $100,000 to $149,999.
11.0% of households in Virginia Beach earn $150,000 to $199,999.
14.1% of households in Virginia Beach earn $200,000 or more.
| Income | Virginia Beach | VA | USA |
|---|---|---|---|
| Less than $10,000 | 3.7% | 4.2% | 5.0% |
| $10,000 to $14,999 | 2.2% | 2.7% | 3.4% |
| $15,000 to $24,999 | 3.7% | 5.2% | 6.3% |
| $25,000 to $34,999 | 4.9% | 5.7% | 6.6% |
| $35,000 to $49,999 | 8.1% | 8.8% | 10.1% |
| $50,000 to $74,999 | 17.9% | 14.3% | 15.5% |
| $75,000 to $99,999 | 13.0% | 12.1% | 12.6% |
| $100,000 to $149,999 | 21.3% | 18.1% | 17.5% |
| $150,000 to $199,999 | 11.0% | 11.1% | 9.6% |
| $200,000 or more | 14.1% | 17.7% | 13.4% |
Source: U.S. Census ACS 5-year estimates (2024)


