Longview SnackAbility
Overall SnackAbility
Crime in Longview summary. We use data from the FBI to determine the crime rates in Longview. Key points include:
There were 1,287 total crimes in Longview in the last reporting year.
The overall crime rate per 100,000 people in Longview is 3,391.8 / 100k people.
The violent crime rate per 100,000 people in Longview is 216.1 / 100k people.
The property crime rate per 100,000 people in Longview is 3,175.7 / 100k people.
Overall, crime in Longview is 60.05% above the national average.
Total Crimes
Above National Average
Crime In Longview Comparison Table
| Statistic | Count Raw |
Longview / 100k People |
Washington / 100k People |
National / 100k People |
|---|---|---|---|---|
| Total Crimes Per 100K | 1,287 | 3,391.8 | 2,792.6 | 2,119.2 |
| Violent Crime | 82 | 216.1 | 326.1 | 359.0 |
| Murder | 1 | 2.6 | 3.8 | 5.0 |
| Robbery | 13 | 34.3 | 67.5 | 61.0 |
| Aggravated Assault | 52 | 137.0 | 217.0 | 256.0 |
| Property Crime | 1,205 | 3,175.7 | 2,466.5 | 1,760.0 |
| Burglary | 88 | 231.9 | 398.8 | 229.0 |
| Larceny | 1,028 | 2,709.3 | 1,634.2 | 1,272.0 |
| Car Theft | 89 | 234.6 | 433.5 | 259.0 |
Source: FBI Uniform Crime Reporting (2024)
Cost of living in Longview summary. We use data on the cost of living to determine how expensive it is to live in Longview. Real estate prices drive most of the variance in cost of living around Washington. Key points include:
The cost of living in Longview is 108 with 100 being average.
The cost of living in Longview is 1.1x higher than the national average.
The median home value in Longview is $385,309.
The median income in Longview is $61,747.
Longview's Overall Cost Of Living
Higher Than The National Average
Cost Of Living In Longview Comparison Table
| Living Expense | Longview | Washington | National Average |
|---|---|---|---|
| Overall | 108 | 120 | 100 |
| Services | 105 | 108 | 100 |
| Groceries | 109 | 108 | 100 |
| Health | 109 | 137 | 100 |
| Housing | 110 | 111 | 100 |
| Transportation | 112 | 111 | 100 |
| Utilities | 110 | 110 | 100 |
Source: Cost of living index, normalized to US average = 100
Longview, WA Weather
The average high in Longview is 61.4° and the average low is 42.8°.
There are 41.3 days of precipitation each year.
Expect an average of 47.2 inches of precipitation each year with 4.2 inches of snow.
| Stat | Longview |
|---|---|
| Average Annual High | 61.4 |
| Average Annual Low | 42.8 |
| Annual Precipitation Days | 41.3 |
| Average Annual Precipitation | 47.2 |
| Average Annual Snowfall | 4.2 |
Average High
Days of Rain
Source: NOAA climate normals (30-year)
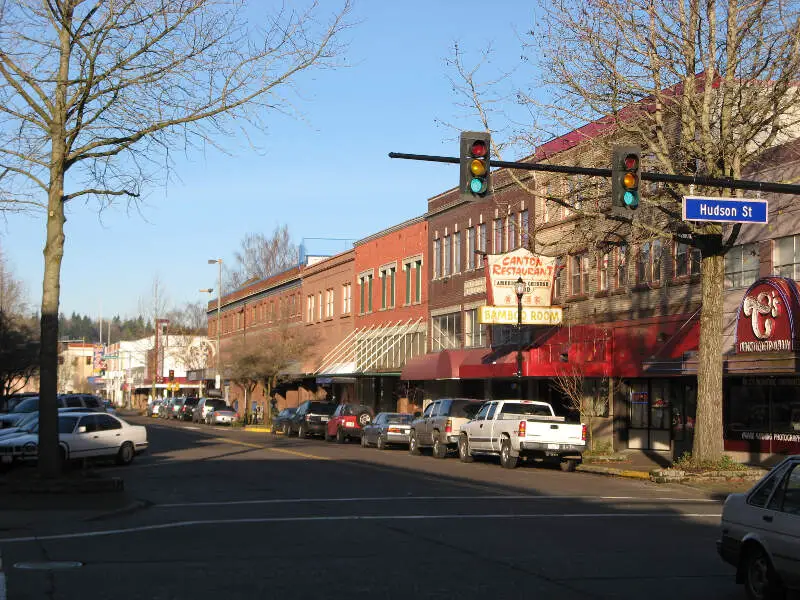
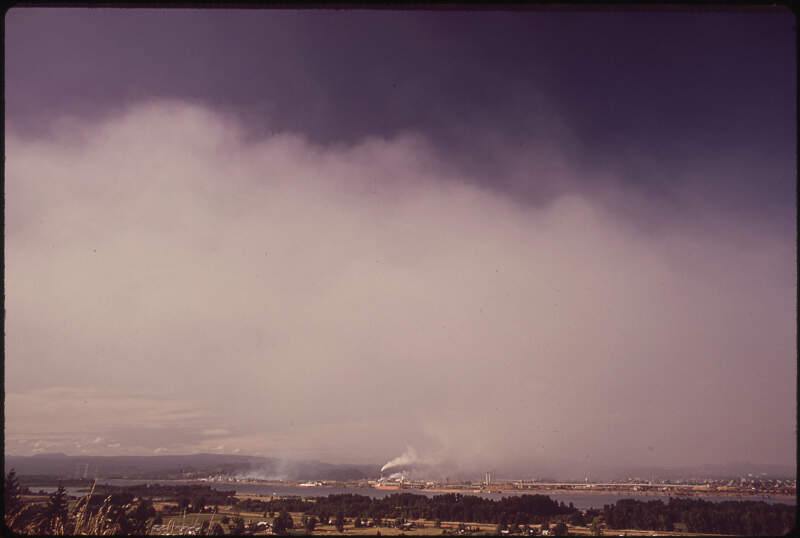
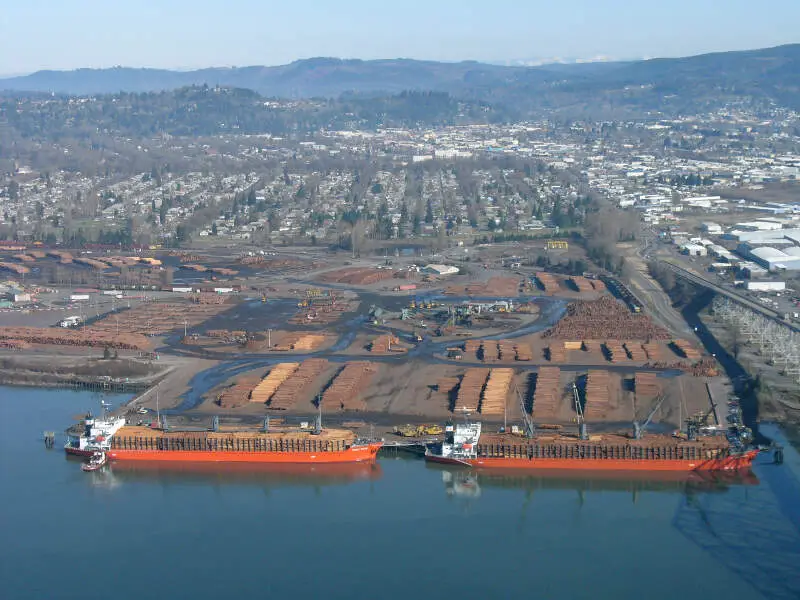
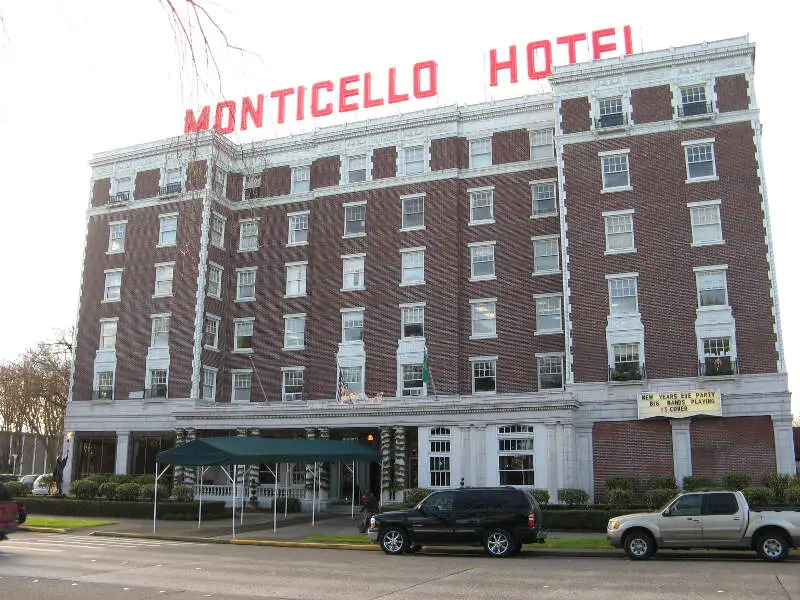
Longview, WA Photos

Rankings & Articles For Longview


Locations Around Longview
Map Of Longview, WA
Best Places Around Longview
Chehalis, WA
Population 7,587
Woodland, WA
Population 6,487
Centralia, WA
Population 18,830
Kelso, WA
Population 12,684
Columbia, PA
Population 10,278
Washougal, WA
Population 17,490
Battle Ground, WA
Population 21,886
Hazel Dell, WA
Population 23,237
Vancouver, WA
Population 195,300
Longview Demographics And Statistics
Population over time in Longview
The current population in Longview is 38,069. The population has increased 4.0% from 2010.
| Year | Population | % Change |
|---|---|---|
| 2024 | 38,069 | 0.6% |
| 2023 | 37,836 | 0.3% |
| 2022 | 37,722 | 0.5% |
| 2021 | 37,542 | -1.0% |
| 2020 | 37,914 | 1.1% |
| 2019 | 37,520 | 1.2% |
| 2018 | 37,092 | 1.0% |
| 2017 | 36,740 | 0.1% |
| 2016 | 36,720 | 0.3% |
| 2015 | 36,619 | 0.1% |
| 2014 | 36,589 | -0.2% |
| 2013 | 36,656 | -0.0% |
| 2012 | 36,660 | -0.1% |
| 2011 | 36,695 | 0.2% |
| 2010 | 36,605 | - |
Race / Ethnicity in Longview
See the full breakdown
Longview is:
77.2% White with 29,380 White residents.
0.6% African American with 227 African American residents.
0.8% American Indian with 318 American Indian residents.
1.7% Asian with 652 Asian residents.
0.0% Hawaiian with 8 Hawaiian residents.
0.2% Other with 95 Other residents.
6.8% Two Or More with 2,587 Two Or More residents.
12.6% Hispanic with 4,802 Hispanic residents.
| Race | Longview | WA | USA |
|---|---|---|---|
| White | 77.2% | 63.1% | 57.4% |
| African American | 0.6% | 3.8% | 11.9% |
| American Indian | 0.8% | 0.8% | 0.5% |
| Asian | 1.7% | 9.7% | 5.9% |
| Hawaiian | 0.0% | 0.7% | 0.2% |
| Other | 0.2% | 0.6% | 0.6% |
| Two Or More | 6.8% | 6.8% | 4.3% |
| Hispanic | 12.6% | 14.4% | 19.3% |
Gender in Longview
See the full breakdown
Longview is 51.7% female with 19,664 female residents.
Longview is 48.3% male with 18,405 male residents.
| Gender | Longview | WA | USA |
|---|---|---|---|
| Female | 51.7% | 49.6% | 50.5% |
| Male | 48.3% | 50.4% | 49.5% |
Highest level of educational attainment in Longview for adults over 25
See the full breakdown
4.0% of adults in Longview completed < 9th grade.
8.0% of adults in Longview completed 9-12th grade.
32.0% of adults in Longview completed high school / ged.
27.0% of adults in Longview completed some college.
12.0% of adults in Longview completed associate's degree.
11.0% of adults in Longview completed bachelor's degree.
5.0% of adults in Longview completed master's degree.
0.0% of adults in Longview completed professional degree.
1.0% of adults in Longview completed doctorate degree.
| Education | Longview | WA | USA |
|---|---|---|---|
| < 9th Grade | 4.0% | 4.0% | 4.0% |
| 9-12th Grade | 8.0% | 4.0% | 6.0% |
| High School / GED | 32.0% | 22.0% | 26.0% |
| Some College | 27.0% | 21.0% | 19.0% |
| Associate's Degree | 12.0% | 10.0% | 9.0% |
| Bachelor's Degree | 11.0% | 24.0% | 22.0% |
| Master's Degree | 5.0% | 11.0% | 10.0% |
| Professional Degree | 0.0% | 2.0% | 2.0% |
| Doctorate Degree | 1.0% | 2.0% | 2.0% |
Household Income For Longview, Washington
See the full breakdown
4.7% of households in Longview earn Less than $10,000.
6.0% of households in Longview earn $10,000 to $14,999.
7.5% of households in Longview earn $15,000 to $24,999.
9.9% of households in Longview earn $25,000 to $34,999.
13.8% of households in Longview earn $35,000 to $49,999.
15.7% of households in Longview earn $50,000 to $74,999.
14.8% of households in Longview earn $75,000 to $99,999.
16.5% of households in Longview earn $100,000 to $149,999.
6.6% of households in Longview earn $150,000 to $199,999.
4.5% of households in Longview earn $200,000 or more.
| Income | Longview | WA | USA |
|---|---|---|---|
| Less than $10,000 | 4.7% | 3.9% | 5.0% |
| $10,000 to $14,999 | 6.0% | 2.5% | 3.4% |
| $15,000 to $24,999 | 7.5% | 4.6% | 6.3% |
| $25,000 to $34,999 | 9.9% | 5.0% | 6.6% |
| $35,000 to $49,999 | 13.8% | 8.2% | 10.1% |
| $50,000 to $74,999 | 15.7% | 14.1% | 15.5% |
| $75,000 to $99,999 | 14.8% | 12.4% | 12.6% |
| $100,000 to $149,999 | 16.5% | 19.2% | 17.5% |
| $150,000 to $199,999 | 6.6% | 11.4% | 9.6% |
| $200,000 or more | 4.5% | 18.5% | 13.4% |
Source: U.S. Census ACS 5-year estimates (2024)


