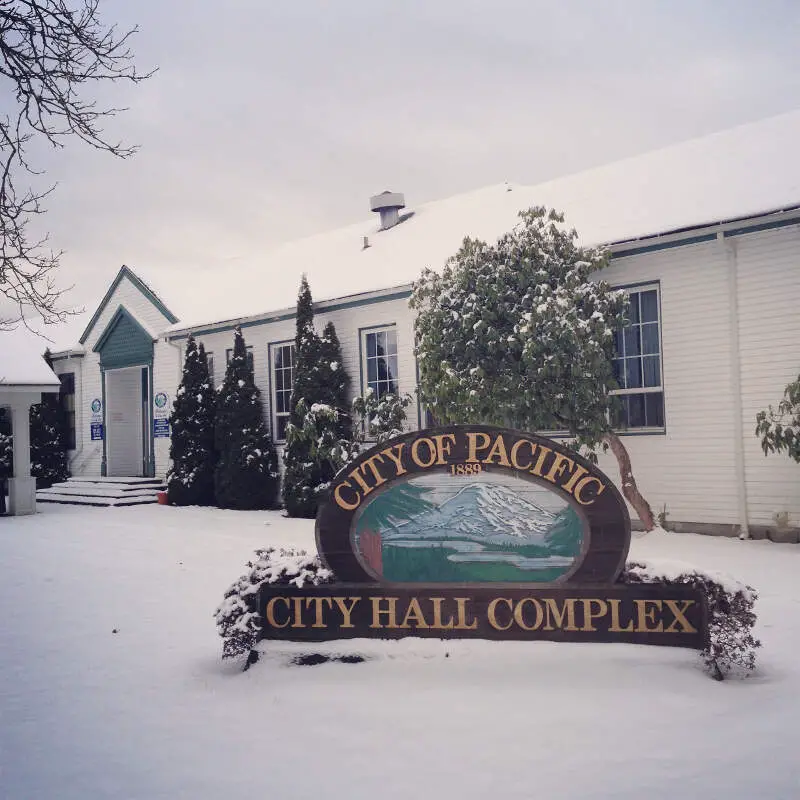
Pacific SnackAbility
Overall SnackAbility
Crime in Pacific summary. We use data from the FBI to determine the crime rates in Pacific. Key points include:
There were 136 total crimes in Pacific in the last reporting year.
The overall crime rate per 100,000 people in Pacific is 1,992.1 / 100k people.
The violent crime rate per 100,000 people in Pacific is 190.4 / 100k people.
The property crime rate per 100,000 people in Pacific is 1,801.7 / 100k people.
Overall, crime in Pacific is -6.00% below the national average.
Total Crimes
Below National Average
Crime In Pacific Comparison Table
| Statistic | Count Raw |
Pacific / 100k People |
Washington / 100k People |
National / 100k People |
|---|---|---|---|---|
| Total Crimes Per 100K | 136 | 1,992.1 | 2,792.6 | 2,119.2 |
| Violent Crime | 13 | 190.4 | 326.1 | 359.0 |
| Murder | 0 | 0.0 | 3.8 | 5.0 |
| Robbery | 4 | 58.6 | 67.5 | 61.0 |
| Aggravated Assault | 9 | 131.8 | 217.0 | 256.0 |
| Property Crime | 123 | 1,801.7 | 2,466.5 | 1,760.0 |
| Burglary | 40 | 585.9 | 398.8 | 229.0 |
| Larceny | 42 | 615.2 | 1,634.2 | 1,272.0 |
| Car Theft | 41 | 600.6 | 433.5 | 259.0 |
Source: FBI Uniform Crime Reporting (2024)
Cost of living in Pacific summary. We use data on the cost of living to determine how expensive it is to live in Pacific. Real estate prices drive most of the variance in cost of living around Washington. Key points include:
The cost of living in Pacific is 126 with 100 being average.
The cost of living in Pacific is 1.3x higher than the national average.
The median home value in Pacific is $561,715.
The median income in Pacific is $115,625.
Pacific's Overall Cost Of Living
Higher Than The National Average
Cost Of Living In Pacific Comparison Table
| Living Expense | Pacific | Washington | National Average |
|---|---|---|---|
| Overall | 126 | 120 | 100 |
| Services | 109 | 108 | 100 |
| Groceries | 110 | 108 | 100 |
| Health | 163 | 137 | 100 |
| Housing | 113 | 111 | 100 |
| Transportation | 113 | 111 | 100 |
| Utilities | 107 | 110 | 100 |
Source: Cost of living index, normalized to US average = 100
Pacific, WA Weather
The average high in Pacific is 61.3° and the average low is 44.1°.
There are 123.8 days of precipitation each year.
Expect an average of 39.5 inches of precipitation each year with 4.5 inches of snow.
| Stat | Pacific |
|---|---|
| Average Annual High | 61.3 |
| Average Annual Low | 44.1 |
| Annual Precipitation Days | 123.8 |
| Average Annual Precipitation | 39.5 |
| Average Annual Snowfall | 4.5 |
Average High
Days of Rain
Source: NOAA climate normals (30-year)
Pacific, WA Photos
1 Reviews & Comments About Pacific

i live in pacific, the park got flooded again and they never cleaned it back up or unblocked it, last summer they still had the flood barriers up in august, pacific just has reallly bad property crime, although i do hear shots at night sometimes the worst i have seen is a gang fight
Rankings & Articles For Pacific


Locations Around Pacific
Map Of Pacific, WA
Best Places Around Pacific
Keizer, OR
Population 39,082
Salem, OR
Population 178,865
Newberg, OR
Population 26,066
Dallas, OR
Population 17,531
Cornelius, OR
Population 14,255
Newport, OR
Population 10,583
McMinnville, OR
Population 34,596
Independence, OR
Population 10,199
Monmouth, OR
Population 11,428
Forest Grove, OR
Population 26,529
Pacific Demographics And Statistics
Population over time in Pacific
The current population in Pacific is 7,066. The population has increased 9.5% from 2010.
| Year | Population | % Change |
|---|---|---|
| 2024 | 7,066 | 0.0% |
| 2023 | 7,064 | -0.5% |
| 2022 | 7,097 | -0.5% |
| 2021 | 7,130 | 0.1% |
| 2020 | 7,122 | -1.3% |
| 2019 | 7,215 | 0.5% |
| 2018 | 7,177 | 0.9% |
| 2017 | 7,113 | 1.0% |
| 2016 | 7,042 | 1.3% |
| 2015 | 6,954 | 1.6% |
| 2014 | 6,845 | 0.4% |
| 2013 | 6,816 | 2.3% |
| 2012 | 6,666 | 1.7% |
| 2011 | 6,556 | 1.6% |
| 2010 | 6,455 | - |
Race / Ethnicity in Pacific
See the full breakdown
Pacific is:
51.4% White with 3,630 White residents.
6.7% African American with 473 African American residents.
0.3% American Indian with 20 American Indian residents.
10.7% Asian with 756 Asian residents.
3.4% Hawaiian with 239 Hawaiian residents.
0.0% Other with 0 Other residents.
5.2% Two Or More with 364 Two Or More residents.
22.4% Hispanic with 1,584 Hispanic residents.
| Race | Pacific | WA | USA |
|---|---|---|---|
| White | 51.4% | 63.1% | 57.4% |
| African American | 6.7% | 3.8% | 11.9% |
| American Indian | 0.3% | 0.8% | 0.5% |
| Asian | 10.7% | 9.7% | 5.9% |
| Hawaiian | 3.4% | 0.7% | 0.2% |
| Other | 0.0% | 0.6% | 0.6% |
| Two Or More | 5.2% | 6.8% | 4.3% |
| Hispanic | 22.4% | 14.4% | 19.3% |
Gender in Pacific
See the full breakdown
Pacific is 48.3% female with 3,410 female residents.
Pacific is 51.7% male with 3,655 male residents.
| Gender | Pacific | WA | USA |
|---|---|---|---|
| Female | 48.3% | 49.6% | 50.5% |
| Male | 51.7% | 50.4% | 49.5% |
Highest level of educational attainment in Pacific for adults over 25
See the full breakdown
6.0% of adults in Pacific completed < 9th grade.
7.0% of adults in Pacific completed 9-12th grade.
28.0% of adults in Pacific completed high school / ged.
23.0% of adults in Pacific completed some college.
13.0% of adults in Pacific completed associate's degree.
16.0% of adults in Pacific completed bachelor's degree.
6.0% of adults in Pacific completed master's degree.
1.0% of adults in Pacific completed professional degree.
0.0% of adults in Pacific completed doctorate degree.
| Education | Pacific | WA | USA |
|---|---|---|---|
| < 9th Grade | 6.0% | 4.0% | 4.0% |
| 9-12th Grade | 7.0% | 4.0% | 6.0% |
| High School / GED | 28.0% | 22.0% | 26.0% |
| Some College | 23.0% | 21.0% | 19.0% |
| Associate's Degree | 13.0% | 10.0% | 9.0% |
| Bachelor's Degree | 16.0% | 24.0% | 22.0% |
| Master's Degree | 6.0% | 11.0% | 10.0% |
| Professional Degree | 1.0% | 2.0% | 2.0% |
| Doctorate Degree | 0.0% | 2.0% | 2.0% |
Household Income For Pacific, Washington
See the full breakdown
6.6% of households in Pacific earn Less than $10,000.
4.2% of households in Pacific earn $10,000 to $14,999.
4.4% of households in Pacific earn $15,000 to $24,999.
3.1% of households in Pacific earn $25,000 to $34,999.
4.9% of households in Pacific earn $35,000 to $49,999.
15.3% of households in Pacific earn $50,000 to $74,999.
6.8% of households in Pacific earn $75,000 to $99,999.
25.6% of households in Pacific earn $100,000 to $149,999.
15.1% of households in Pacific earn $150,000 to $199,999.
14.1% of households in Pacific earn $200,000 or more.
| Income | Pacific | WA | USA |
|---|---|---|---|
| Less than $10,000 | 6.6% | 3.9% | 5.0% |
| $10,000 to $14,999 | 4.2% | 2.5% | 3.4% |
| $15,000 to $24,999 | 4.4% | 4.6% | 6.3% |
| $25,000 to $34,999 | 3.1% | 5.0% | 6.6% |
| $35,000 to $49,999 | 4.9% | 8.2% | 10.1% |
| $50,000 to $74,999 | 15.3% | 14.1% | 15.5% |
| $75,000 to $99,999 | 6.8% | 12.4% | 12.6% |
| $100,000 to $149,999 | 25.6% | 19.2% | 17.5% |
| $150,000 to $199,999 | 15.1% | 11.4% | 9.6% |
| $200,000 or more | 14.1% | 18.5% | 13.4% |
Source: U.S. Census ACS 5-year estimates (2024)


