Compare Madison to…
Madison SnackAbility
Overall SnackAbility
Crime in Madison summary. We use data from the FBI to determine the crime rates in Madison. Key points include:
There were 5,982 total crimes in Madison in the last reporting year.
The overall crime rate per 100,000 people in Madison is 2,120.9 / 100k people.
The violent crime rate per 100,000 people in Madison is 256.0 / 100k people.
The property crime rate per 100,000 people in Madison is 1,865.0 / 100k people.
Overall, crime in Madison is 0.08% above the national average.
Total Crimes
Above National Average
Crime In Madison Comparison Table
| Statistic | Count Raw |
Madison / 100k People |
Wisconsin / 100k People |
National / 100k People |
|---|---|---|---|---|
| Total Crimes Per 100K | 5,982 | 2,120.9 | 1,432.6 | 2,119.2 |
| Violent Crime | 722 | 256.0 | 278.5 | 359.0 |
| Murder | 7 | 2.5 | 4.2 | 5.0 |
| Robbery | 95 | 33.7 | 39.4 | 61.0 |
| Aggravated Assault | 545 | 193.2 | 200.1 | 256.0 |
| Property Crime | 5,260 | 1,865.0 | 1,154.1 | 1,760.0 |
| Burglary | 447 | 158.5 | 117.2 | 229.0 |
| Larceny | 4,500 | 1,595.5 | 875.6 | 1,272.0 |
| Car Theft | 313 | 111.0 | 161.3 | 259.0 |
Source: FBI Uniform Crime Reporting (2024)
Cost of living in Madison summary. We use data on the cost of living to determine how expensive it is to live in Madison. Real estate prices drive most of the variance in cost of living around Wisconsin. Key points include:
The cost of living in Madison is 110 with 100 being average.
The cost of living in Madison is 1.1x higher than the national average.
The median home value in Madison is $423,766.
The median income in Madison is $78,050.
Madison's Overall Cost Of Living
Higher Than The National Average
Cost Of Living In Madison Comparison Table
| Living Expense | Madison | Wisconsin | National Average |
|---|---|---|---|
| Overall | 110 | 98 | 100 |
| Services | 97 | 98 | 100 |
| Groceries | 95 | 100 | 100 |
| Health | 138 | 91 | 100 |
| Housing | 97 | 99 | 100 |
| Transportation | 106 | 102 | 100 |
| Utilities | 100 | 100 | 100 |
Source: Cost of living index, normalized to US average = 100
Madison, WI Weather
The average high in Madison is 56.3° and the average low is 36.6°.
There are 69.8 days of precipitation each year.
Expect an average of 35.5 inches of precipitation each year with 42.9 inches of snow.
| Stat | Madison |
|---|---|
| Average Annual High | 56.3 |
| Average Annual Low | 36.6 |
| Annual Precipitation Days | 69.8 |
| Average Annual Precipitation | 35.5 |
| Average Annual Snowfall | 42.9 |
Average High
Days of Rain
Source: NOAA climate normals (30-year)
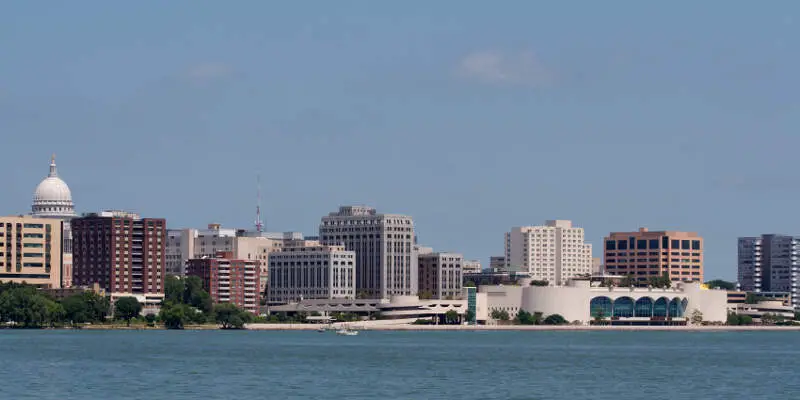
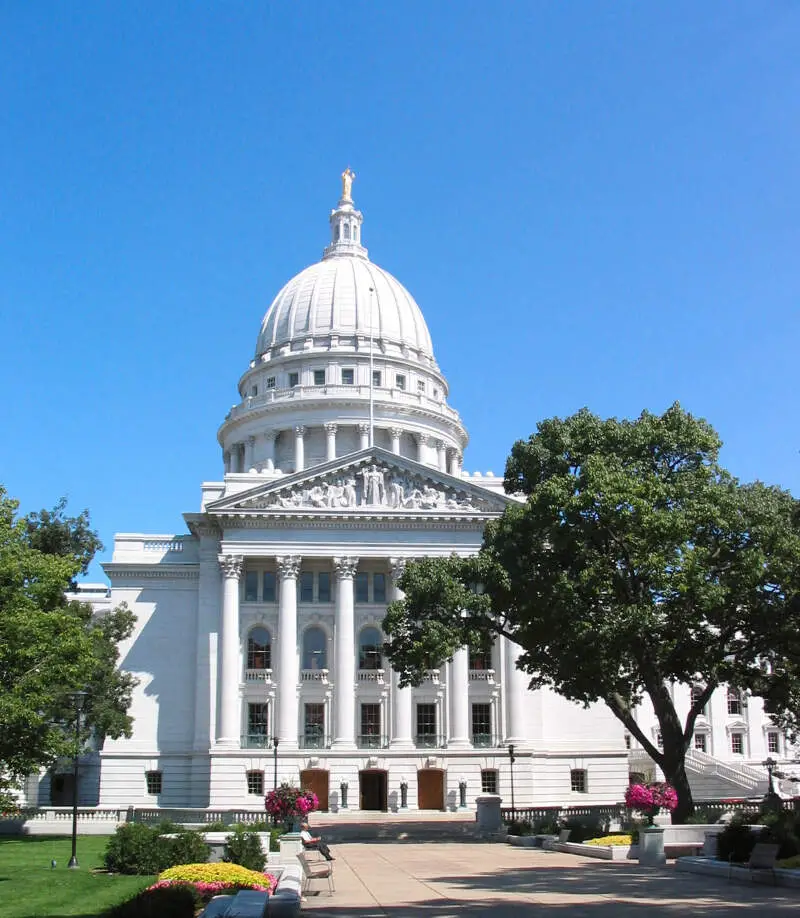
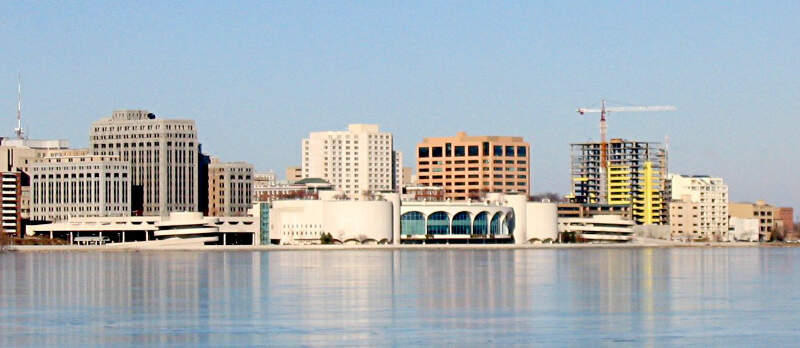
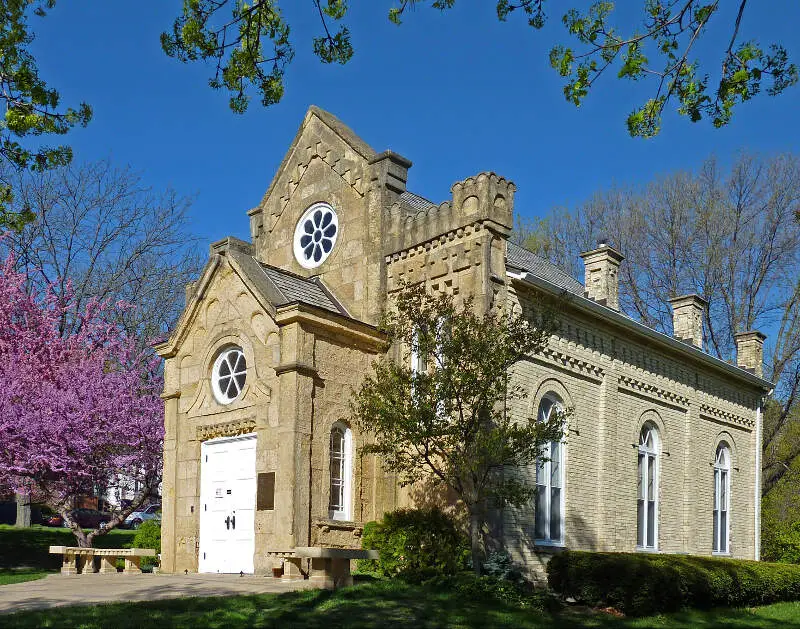
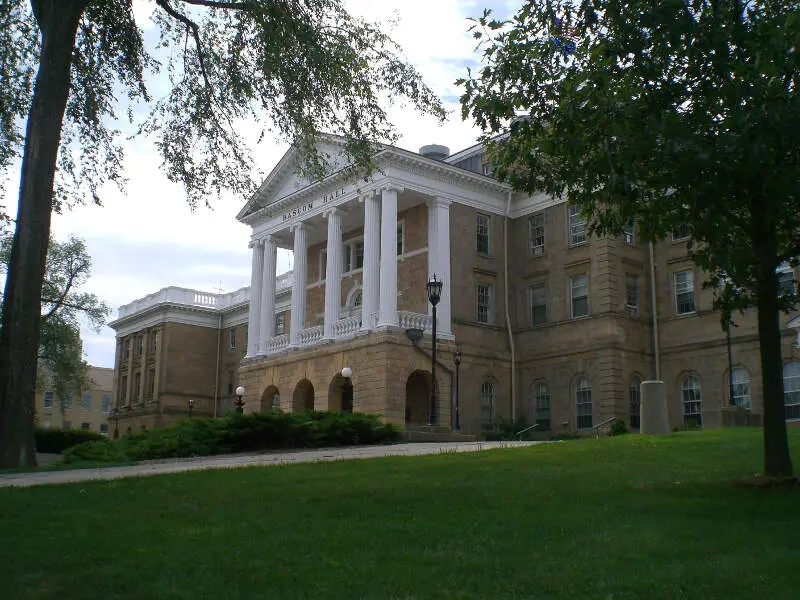
Madison, WI Photos


1 Reviews & Comments About Madison

I'm not sure how the crime is because I'm not in Madison enough to know. The schools seem to be decent which I only know because I have cousins that live there. There is lots to do in Madison so that's why I like going there from time to time. The also offer free things to do like go to the zoo which is really nice.
My favorite places to go are the disc golf courses that are around and in the Madison area. My husband and I really enjoy going disc golfing and there is multiple places to choose from which is really nice.
Rankings & Articles For Madison


Locations Around Madison
Map Of Madison, WI
Best Places Around Madison
Waunakee, WI
Population 15,687
Cottage Grove, WI
Population 8,513
Verona, WI
Population 15,232
Oregon, WI
Population 11,547
McFarland, WI
Population 9,160
Mount Horeb, WI
Population 7,736
DeForest, WI
Population 11,501
Sun Prairie, WI
Population 37,570
Middleton, WI
Population 22,301
Stoughton, WI
Population 13,033
Madison Demographics And Statistics
Population over time in Madison
The current population in Madison is 278,001. The population has increased 21.3% from 2010.
| Year | Population | % Change |
|---|---|---|
| 2024 | 278,001 | 0.9% |
| 2023 | 275,568 | 2.6% |
| 2022 | 268,516 | 1.2% |
| 2021 | 265,447 | 2.7% |
| 2020 | 258,366 | 1.3% |
| 2019 | 254,977 | 1.1% |
| 2018 | 252,086 | 1.3% |
| 2017 | 248,856 | 1.1% |
| 2016 | 246,034 | 1.2% |
| 2015 | 243,122 | 1.4% |
| 2014 | 239,848 | 1.0% |
| 2013 | 237,395 | 1.2% |
| 2012 | 234,586 | 1.2% |
| 2011 | 231,783 | 1.1% |
| 2010 | 229,236 | - |
Race / Ethnicity in Madison
See the full breakdown
Madison is:
69.6% White with 193,375 White residents.
7.2% African American with 19,962 African American residents.
0.2% American Indian with 457 American Indian residents.
8.0% Asian with 22,178 Asian residents.
0.0% Hawaiian with 42 Hawaiian residents.
0.5% Other with 1,374 Other residents.
5.2% Two Or More with 14,448 Two Or More residents.
9.4% Hispanic with 26,165 Hispanic residents.
| Race | Madison | WI | USA |
|---|---|---|---|
| White | 69.6% | 78.6% | 57.4% |
| African American | 7.2% | 5.9% | 11.9% |
| American Indian | 0.2% | 0.5% | 0.5% |
| Asian | 8.0% | 2.9% | 5.9% |
| Hawaiian | 0.0% | 0.0% | 0.2% |
| Other | 0.5% | 0.3% | 0.6% |
| Two Or More | 5.2% | 3.7% | 4.3% |
| Hispanic | 9.4% | 8.0% | 19.3% |
Gender in Madison
See the full breakdown
Madison is 50.0% female with 138,936 female residents.
Madison is 50.0% male with 139,065 male residents.
| Gender | Madison | WI | USA |
|---|---|---|---|
| Female | 50.0% | 49.9% | 50.5% |
| Male | 50.0% | 50.1% | 49.5% |
Highest level of educational attainment in Madison for adults over 25
See the full breakdown
1.0% of adults in Madison completed < 9th grade.
2.0% of adults in Madison completed 9-12th grade.
15.0% of adults in Madison completed high school / ged.
14.0% of adults in Madison completed some college.
8.0% of adults in Madison completed associate's degree.
34.0% of adults in Madison completed bachelor's degree.
16.0% of adults in Madison completed master's degree.
4.0% of adults in Madison completed professional degree.
6.0% of adults in Madison completed doctorate degree.
| Education | Madison | WI | USA |
|---|---|---|---|
| < 9th Grade | 1.0% | 4.0% | 4.0% |
| 9-12th Grade | 2.0% | 4.0% | 6.0% |
| High School / GED | 15.0% | 29.0% | 26.0% |
| Some College | 14.0% | 19.0% | 19.0% |
| Associate's Degree | 8.0% | 11.0% | 9.0% |
| Bachelor's Degree | 34.0% | 22.0% | 22.0% |
| Master's Degree | 16.0% | 8.0% | 10.0% |
| Professional Degree | 4.0% | 2.0% | 2.0% |
| Doctorate Degree | 6.0% | 1.0% | 2.0% |
Household Income For Madison, Wisconsin
See the full breakdown
6.2% of households in Madison earn Less than $10,000.
3.2% of households in Madison earn $10,000 to $14,999.
5.9% of households in Madison earn $15,000 to $24,999.
7.1% of households in Madison earn $25,000 to $34,999.
10.4% of households in Madison earn $35,000 to $49,999.
15.8% of households in Madison earn $50,000 to $74,999.
12.4% of households in Madison earn $75,000 to $99,999.
17.5% of households in Madison earn $100,000 to $149,999.
10.1% of households in Madison earn $150,000 to $199,999.
11.4% of households in Madison earn $200,000 or more.
| Income | Madison | WI | USA |
|---|---|---|---|
| Less than $10,000 | 6.2% | 4.1% | 5.0% |
| $10,000 to $14,999 | 3.2% | 3.0% | 3.4% |
| $15,000 to $24,999 | 5.9% | 5.9% | 6.3% |
| $25,000 to $34,999 | 7.1% | 7.2% | 6.6% |
| $35,000 to $49,999 | 10.4% | 10.8% | 10.1% |
| $50,000 to $74,999 | 15.8% | 17.5% | 15.5% |
| $75,000 to $99,999 | 12.4% | 13.8% | 12.6% |
| $100,000 to $149,999 | 17.5% | 19.1% | 17.5% |
| $150,000 to $199,999 | 10.1% | 9.4% | 9.6% |
| $200,000 or more | 11.4% | 9.2% | 13.4% |
Source: U.S. Census ACS 5-year estimates (2024)


