Columbus’s neighborhoods conjure up too many stereotypes to count. You’ve got hipster areas, preppy places, neighborhoods where college kids thrive, and of course, ghettos.
It seems as if there’s a neighborhood for everyone in Columbus.
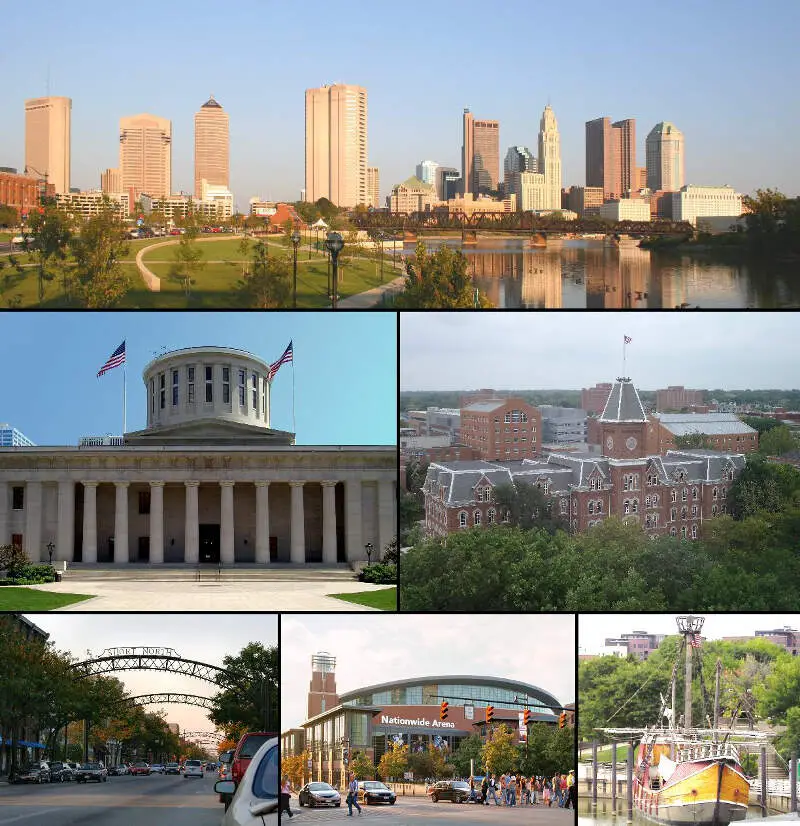
And while the city consistently ranks as one of the best places to live in Ohio thanks in part to tons of entertainment and jobs, it’s not all rainbows and sunshine in Columbus. Some neighborhoods aren’t as safe as others.
So the question arises, which Columbus neighborhoods are the most dangerous and which are the safest?
Today, we’ll use Saturday Night Science to determine which Columbus hoods need a little tender loving care – the sore thumbs of the Columbus area if you will. Realistically, you can’t expect all the neighborhoods to be amazing, although Harrison West ranks way above the rest.
We examined 39 of Columbus’s neighborhoods to find out the most dangerous places to live. These places don’t quite measure up to Columbus’s reputation.
Table Of Contents: Top 10 | Methodology | Summary | Table
So what’s the worst neighborhood to live in Columbus for 2025? According to the most recent census data, Milo Grogan looks to be the worst neighborhood in Columbus.
Read on to see how we determined the places around Columbus that need a pick-me-up. And remember, don’t blame the messenger.
For more Ohio reading, check out:
The 10 Most Dangerous Neighborhoods In Columbus For 2025
1. Milo Grogan
/10
Population: 1,513
Violent Crimes Per 100k: 814
Property Crime Per 100k: 4,586
Median Home Value: $76,300 (10th worst)
Median Income: $24,311 (3rd worst)
2. Fort Columbus Airport
/10
Population: 3,184
Violent Crimes Per 100k: 883
Property Crime Per 100k: 4,972
Median Home Value: $31,675 (2nd worst)
Median Income: $28,221 (5th worst)
3. Olentangy River Road
/10
Population: 3,967
Violent Crimes Per 100k: 880
Property Crime Per 100k: 4,959
Median Home Value: $28,529 (worst)
Median Income: $23,333 (worst)
4. Tri-South
/10
Population: 4,051
Violent Crimes Per 100k: 750
Property Crime Per 100k: 4,226
Median Home Value: $65,500 (6th worst)
Median Income: $33,916 (11th worst)
5. South Linden
/10
Population: 9,828
Violent Crimes Per 100k: 867
Property Crime Per 100k: 4,886
Median Home Value: $64,136 (4th worst)
Median Income: $26,075 (4th worst)
6. North Central
/10
Population: 9,534
Violent Crimes Per 100k: 803
Property Crime Per 100k: 4,526
Median Home Value: $64,230 (5th worst)
Median Income: $31,482 (8th worst)
7. Near Southside
/10
Population: 16,697
Violent Crimes Per 100k: 814
Property Crime Per 100k: 4,588
Median Home Value: $58,285 (3rd worst)
Median Income: $29,952 (7th worst)
8. South Side
/10
Population: 14,750
Violent Crimes Per 100k: 751
Property Crime Per 100k: 4,233
Median Home Value: $75,823 (9th worst)
Median Income: $33,791 (10th worst)
9. Franklinton

/10
Population: 8,060
Violent Crimes Per 100k: 889
Property Crime Per 100k: 5,009
Median Home Value: $74,150 (7th worst)
Median Income: $24,247 (2nd worst)
10. South Alum Creek
/10
Population: 4,981
Violent Crimes Per 100k: 695
Property Crime Per 100k: 3,913
Median Home Value: $95,450 (19th worst)
Median Income: $49,726 (20th worst)
Methodology: How we determined the most dangerous Columbus neighborhoods in 2025
To figure out how bad a place is to live in, we only needed to know what kinds of things people like and then decide what places have the least amount of those things. We plugged the following criteria into Saturday Night Science to get the worst neighborhoods in Columbus:
- High crime (Estimated)
- High unemployment (Less jobs)
- Low median income (Less pay)
- Low population density (No things to do)
- Low home values (No one’s willing to pay to live here)
Then, we ranked each neighborhood in Columbus, Ohio for each of these criteria from worst to best.
Next, we averaged the individual rankings for each criterion into a “Worst Score.”
The neighborhood with the lowest “Worst Score” ranks as the most dangerous neighborhood of Columbus.
The article is an opinion based on facts and is meant as infotainment. We updated this article for 2025. This report is our time ranking the worst neighborhoods to live in Columbus.
Skip to the end to see the list of all 39 neighborhoods ranked from worst to best.
Summary: The Worst Neighborhoods Around Columbus
Well, there you have it — the worst of the neighborhoods in Columbus with Milo Grogan landing at the bottom of the pack.
The worst neighborhoods in Columbus are Milo Grogan, Fort Columbus Airport, Olentangy River Road, Tri-South, South Linden, North Central, Near Southside, South Side, Franklinton, and South Alum Creek.
As mentioned earlier, the neighborhoods in Columbus aren’t all bad. Harrison West takes the cake as the best place to live in Columbus.
The best neighborhoods in Columbus are Harrison West, Bexley, Clintonville, Upper Arlington, and Victorican Village.
We ranked the neighborhoods from worst to best in the chart below.
For more Ohio reading, check out:
Most Dangerous Neighborhoods To Live In Columbus For 2025?
| Rank | Neighborhood | Population | Home Value | Median Income |
|---|---|---|---|---|
| 1 | Milo Grogan | 1,513 | $76,300 | $24,311 |
| 2 | Fort Columbus Airport | 3,184 | $31,675 | $28,221 |
| 3 | Olentangy River Road | 3,967 | $28,529 | $23,333 |
| 4 | Tri-South | 4,051 | $65,500 | $33,916 |
| 5 | South Linden | 9,828 | $64,136 | $26,075 |
| 6 | North Central | 9,534 | $64,230 | $31,482 |
| 7 | Near Southside | 16,697 | $58,285 | $29,952 |
| 8 | South Side | 14,750 | $75,823 | $33,791 |
| 9 | Franklinton | 8,060 | $74,150 | $24,247 |
| 10 | South Alum Creek | 4,981 | $95,450 | $49,726 |
| 11 | Far South | 13,301 | $78,615 | $39,897 |
| 12 | Northeast | 29,406 | $81,032 | $34,150 |
| 13 | Whitehall | 18,878 | $77,695 | $39,753 |
| 14 | Greater Hilltop | 65,257 | $74,258 | $37,375 |
| 15 | South Central Accord | 2,511 | $151,800 | $53,556 |
| 16 | University | 35,689 | $77,338 | $28,806 |
| 17 | Near East | 17,159 | $93,138 | $32,468 |
| 18 | Southeast | 2,922 | $88,860 | $47,200 |
| 19 | North Linden | 30,894 | $86,266 | $40,367 |
| 20 | Westland | 36,756 | $113,830 | $49,688 |
| 21 | Southwest | 8,116 | $86,075 | $55,392 |
| 22 | Southside | 15,464 | $99,115 | $53,356 |
| 23 | Brice-Tussing | 27,035 | $113,760 | $51,585 |
| 24 | Weinland Park | 4,287 | $243,900 | $41,409 |
| 25 | Northland | 122,528 | $123,442 | $54,666 |
| 26 | Mckinley Avenue Corridor | 5,558 | $129,933 | $50,635 |
| 27 | West Columbus Interim | 53,633 | $162,432 | $72,645 |
| 28 | Far North | 33,986 | $189,350 | $77,465 |
| 29 | Rocky-Fork Blacklick Accord | 8,709 | $186,386 | $80,400 |
| 30 | Downtown | 7,097 | $245,240 | $58,670 |
| 31 | Northwest | 79,502 | $176,663 | $71,352 |
| 32 | Worthington | 14,074 | $235,220 | $87,419 |
| 33 | Brewery | 1,967 | $331,050 | $75,120 |
| 34 | Italian Village | 3,530 | $320,000 | $72,750 |
| 35 | Victorican Village | 3,989 | $264,575 | $69,438 |
| 36 | Upper Arlington | 43,520 | $335,316 | $102,607 |
| 37 | Clintonville | 9,039 | $270,860 | $87,515 |
| 38 | Bexley | 13,485 | $337,683 | $114,868 |
| 39 | Harrison West | 3,364 | $394,425 | $93,488 |


