More and more people would prefer to live in the cities and towns that surround Fremont to avoid all the hustle and bustle.
So the question arises: what suburbs of Fremont are the worst?
Today, we’ll use Saturday Night Science to determine which Fremont ‘burbs need a little tender loving care – the sore thumbs of the Fremont area if you will. Realistically, you can only expect some of the suburbs to live up to Fremont proper, although Piedmont certainly tries.
We examined the 44 biggest suburbs of Fremont to find out the worst places to live. And while you won’t necessarily find them on the worst places to live in California lists, these places are a little too far downwind of Fremont in terms of quality of life.
$113,318 median income · $848,427 median home price
 Located in
Alameda County, California
Located in
Alameda County, California
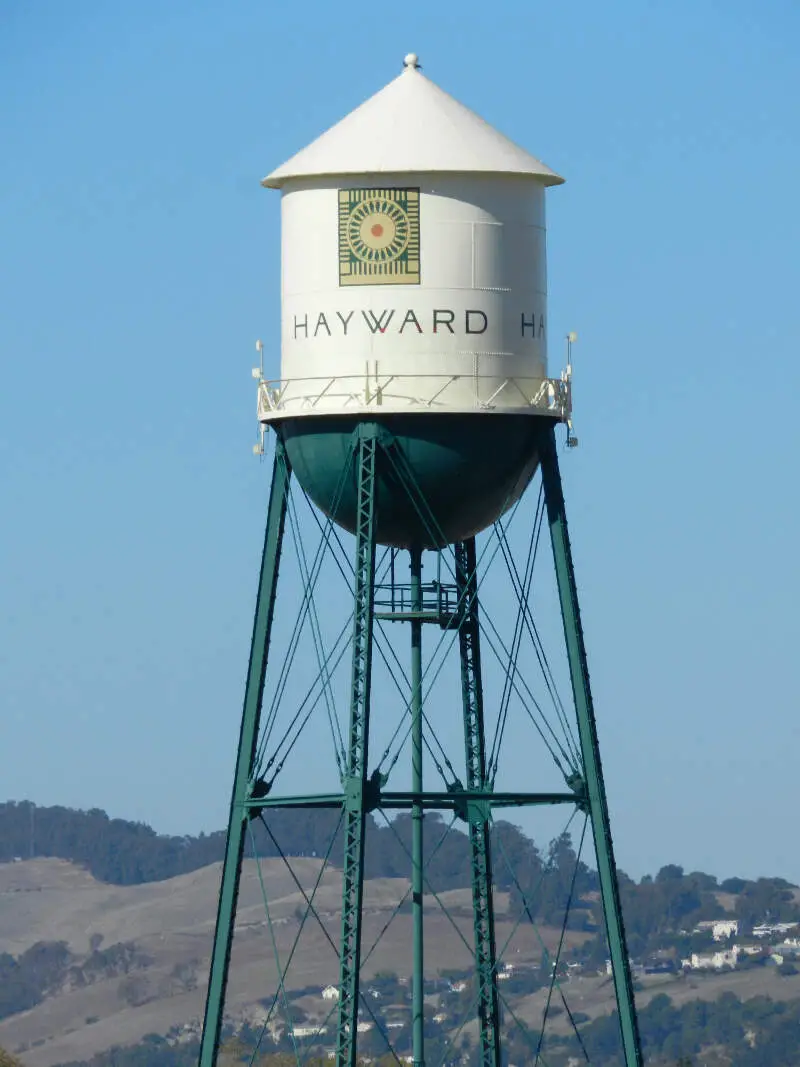
We’ll get the ball rolling with Hayward, the absolute worst place to live around Fremont according to the data.
And in the world of worst rankings, Hayward beat the competition pretty handily thanks to scoring in the bottom 15% in three major categories. Income is the 3rd worst in the Fremont area, and to make matters worse, the city ranks 3rd worst when it comes to home values.
But hey, at least it’s cheap to live there. But there’s a reason for that… it’s Hayward.
You won’t feel bad about not having a great income for the area. There aren’t a bunch of places to spend your money anyway.
Data | Crime | Cost of living | Movers
$101,600 median income · $716,248 median home price
 Located in
Alameda County, California
Located in
Alameda County, California
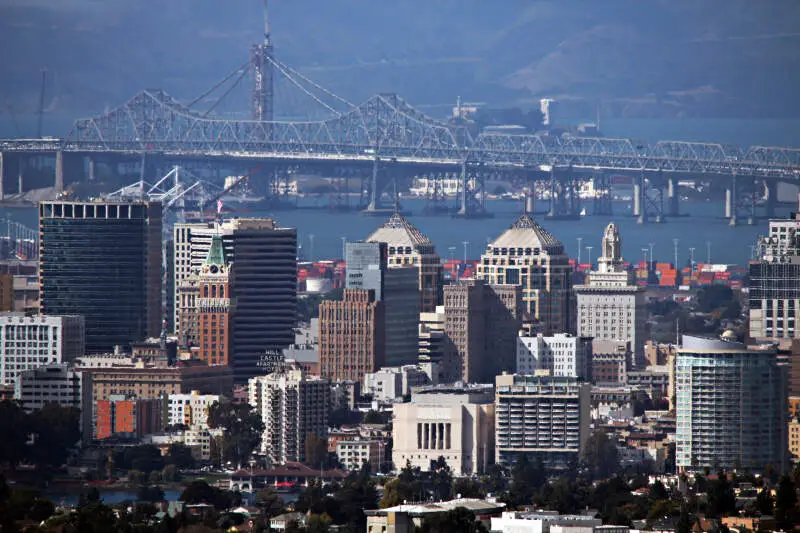
Welcome to Oakland. Home to KMart, Big Lots, and a lot of gas stations.
This city is 24.6 miles to Fremont. Income levels here are the 2nd lowest in the metro area, where families bring in about $101,600 a year, which only goes so far even on a shoestring budget.
But on the bright side, there are a lot of fast food joints in the area.
Data | Crime | Cost of living | Movers | Compare
$101,420 median income · $817,480 median home price
 Located in
Alameda County, California
Located in
Alameda County, California
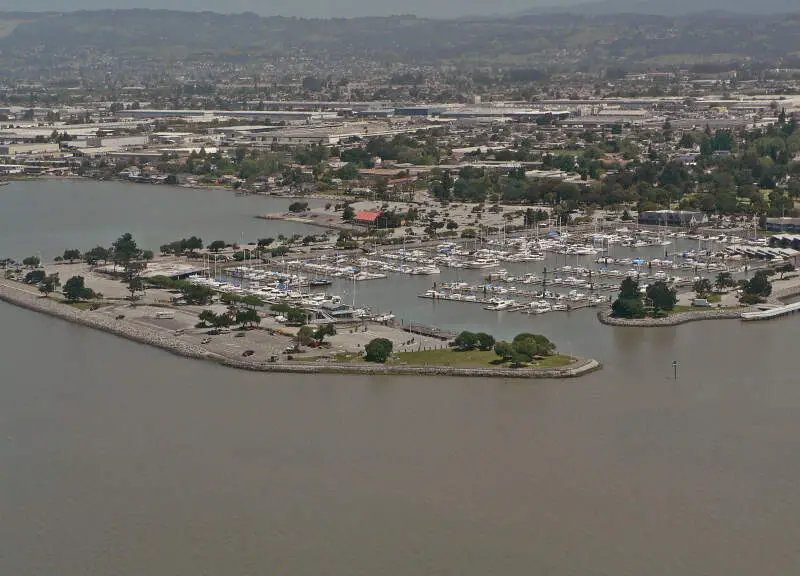
Back up the highway we go for the third worst Fremont suburb you can live in. You might have expected to see San Leandro on here. While the cost of living is low, your entertainment and work options are limited. And that’s an understatement.
In terms of numbers, it’s in the worst 15% for insurance, and the adult high school dropout rate is poor compared to other Fremont suburbs.
But at least there are lovely parks to bring the kids during the day.
Data | Crime | Cost of living | Movers
$113,493 median income · $1,034,441 median home price
 Located in
San Mateo County, California
Located in
San Mateo County, California
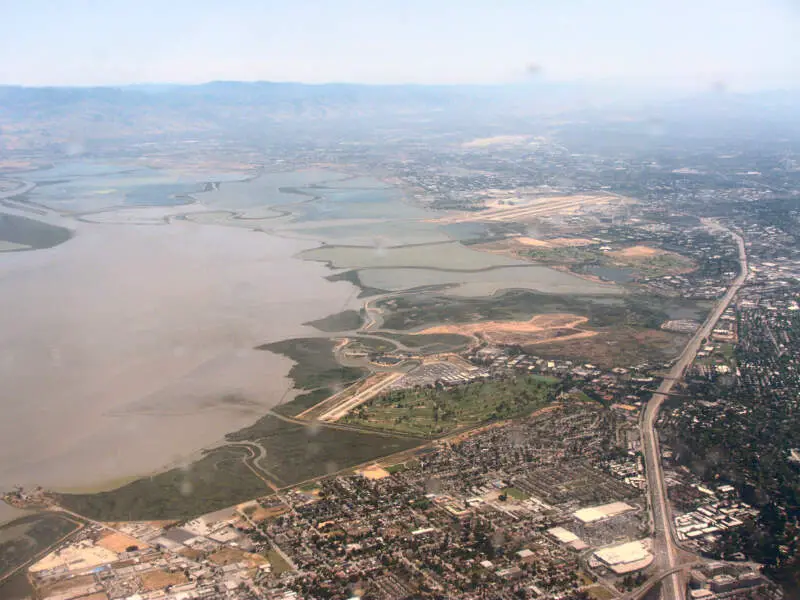
If you live in East Palo Alto, most likely you struggle to make ends meet every month. It ranks as the 4th lowest Fremont suburb for median household incomes.
Not only that, but this is the 17th worst unemployed suburb you can live in if you choose to live near Fremont. Remember, we looked at 44 cities for this study.
East Palo Alto is about 10.6 miles to downtown.
Data | Crime | Cost of living | Movers
$156,169 median income · $1,159,533 median home price
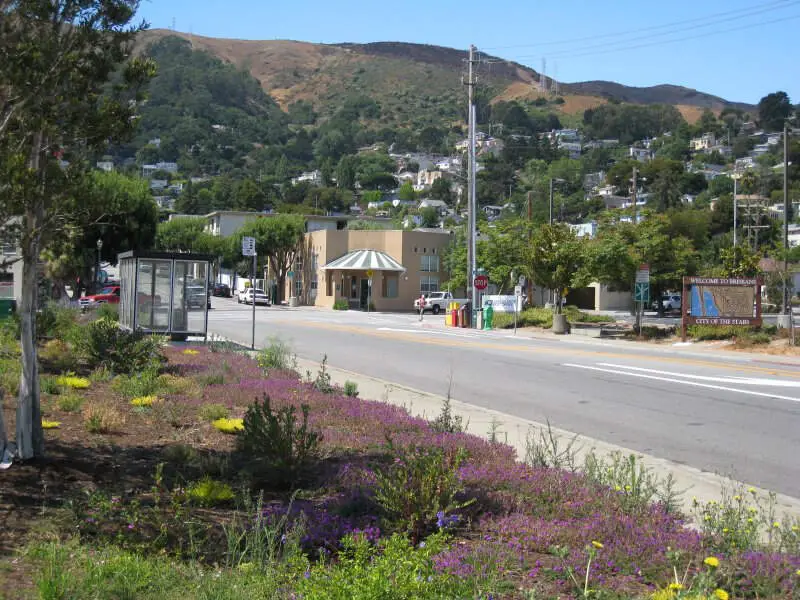
Brisbane has the distinction of being a Fremont suburb. Which means that’s about all it has going for it.
All snarkiness aside, Brisbane has the 8th lowest home values in the metro Fremont area, where the median price is $1,159,533. The median income is $250,001.
Brisbane has an unemployment rate of 8.7% which ranks worst.
Data | Crime | Cost of living | Movers
$146,427 median income · $1,463,614 median home price
 Located in
Santa Clara County, California
Located in
Santa Clara County, California
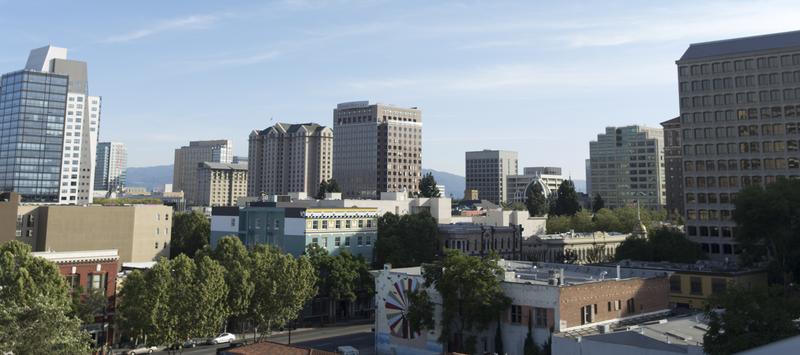
San Jose has 990,138 residents that probably know it’s a pretty crummy place to live when you look at the data. (Or, if you’ve ever been there, you don’t need to look at the data.)
Incomes are towards the bottom, and the poverty rate sits at 8.1%.
Data | Crime | Cost of living | Movers | Compare

$130,432 median income · $1,045,017 median home price
 Located in
Contra Costa County, California
Located in
Contra Costa County, California
Ah, Walnut Creek. You rank as the 7th worst place to live around Fremont.
It’s the place with the 8th most out of work residents in the Fremont metro area (6.0%).
Data | Crime | Cost of living | Movers
$141,272 median income · $1,327,402 median home price
 Located in
San Mateo County, California
Located in
San Mateo County, California
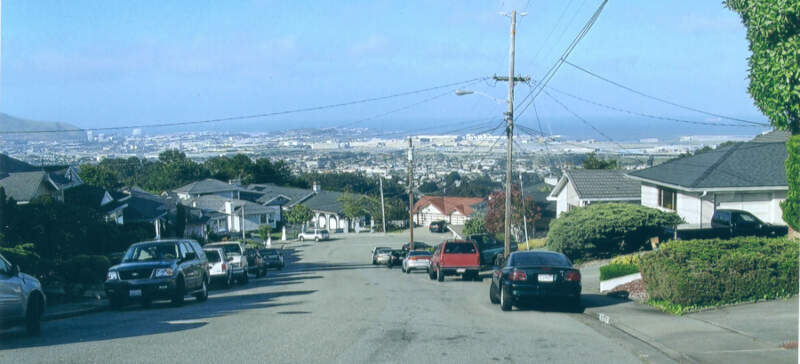
San Bruno is a city about 28.3 miles from Fremont, but Fremont probably wishes it was further away. It ranks as the 8th worst burb.
You’d be hard-pressed to find a worse place to live. San Bruno has the 5th most uninsured people, 8th worst incomes, and has the 20th highest unemployment rate (5.0%) in the entire Fremont metro area.
Homes only cost $1,327,402 for a reason. That’s cheap for Fremont standards.
Data | Crime | Cost of living | Movers
$137,697 median income · $1,155,484 median home price
 Located in
Alameda County, California
Located in
Alameda County, California
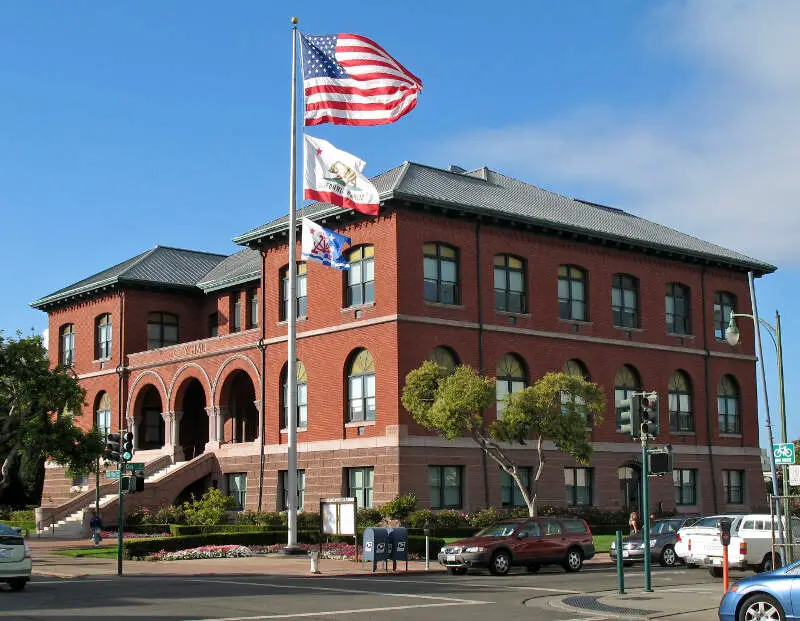
If you absolutely have to live near Fremont, then Alameda might be a place for you to consider as it’s only the 9th worst Fremont suburb.
About 5.7% of residents are out of work.
Data | Crime | Cost of living | Movers
$178,958 median income · $1,782,192 median home price
 Located in
Santa Clara County, California
Located in
Santa Clara County, California
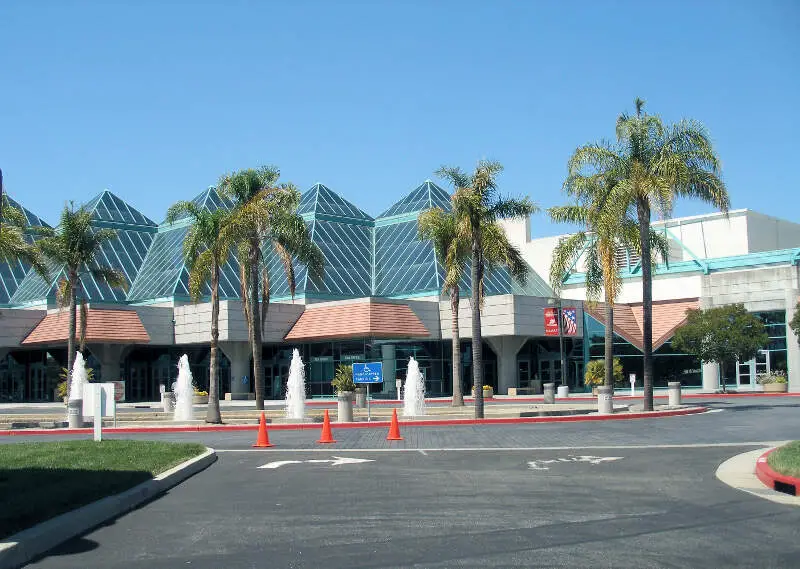
Rounding out the ten worst Fremont suburbs to call home is Santa Clara.
Located 9.1 miles outside the city, Santa Clara is a real pit when you look at the data. Its residents have the 16th highest unemployment rate (5.1%), and poverty is far above the area average.
Data | Crime | Cost of living | Movers
The receipts
Compare the top ten
Pick a metric. The bars rescale. The red line is California’s statewide median.
California statewide median: $99,122
California statewide median: $774,582
California statewide median: 6.6%
California statewide median: 12.0%
On the map
Where the worst Fremont suburbs are
Saturday Night Science
Methodology: Determining The Worst Suburbs Around Fremont for 2026
To figure out how bad a Fremont suburb is to live in, we used Saturday Night Science to identify the kinds of things people like and then decide what suburbs have the least amount of those things.
Using the most recent American Community Survey data from 2020-2024, this is the criteria we used:
- High unemployment rate
- Low median household incomes
- Low population density (no things to do)
- Low home values
- A lot of high school dropouts
- High poverty
- High rate of uninsured families
We defined a suburb as any town within 30 miles of Fremont.
We also limited the analysis to places with over 3,000 people. This left us with a grand total of 44 suburbs to evaluate around Fremont.
We ranked each place with scores from 1 to 44 in each category, where 1 was the worst.
Next, we averaged the rankings for each place to create a quality-of-life index.
And finally, we crowned the city with the worst quality of life index, the “Worst Suburb near Fremont.” We’re looking at you, Hayward.
We updated this article for 2026, which reflects our eleventh time ranking the worst suburbs around Fremont.
The full plate
Detailed List Of The Worst Fremont Suburbs
Click any column to sort. Search by city name.
| Rank | City | Worst Score | Population | Median Income | Median Home Values |
|---|---|---|---|---|---|
| 1 | Hayward | 5.71 | 158,801 | $113,318 | $848,427 |
| 2 | Oakland | 8.50 | 439,418 | $101,600 | $716,248 |
| 3 | San Leandro | 9.00 | 87,826 | $101,420 | $817,480 |
| 4 | East Palo Alto | 10.43 | 29,069 | $113,493 | $1,034,441 |
| 5 | Brisbane | 12.14 | 4,692 | $156,169 | $1,159,533 |
| 6 | San Jose | 12.79 | 990,138 | $146,427 | $1,463,614 |
| 7 | Walnut Creek | 15.36 | 70,088 | $130,432 | $1,045,017 |
| 8 | San Bruno | 16.29 | 42,307 | $141,272 | $1,327,402 |
| 9 | Alameda | 16.43 | 77,238 | $137,697 | $1,155,484 |
| 10 | Santa Clara | 17.71 | 130,256 | $178,958 | $1,782,192 |
| 11 | Half Moon Bay | 17.86 | 11,391 | $157,884 | $1,573,307 |
| 12 | Newark | 18.00 | 46,903 | $169,064 | $1,260,998 |
| 13 | Morgan Hill | 18.00 | 45,425 | $163,920 | $1,356,869 |
| 14 | San Mateo | 18.14 | 103,105 | $153,504 | $1,686,905 |
| 15 | South San Francisco | 18.14 | 64,305 | $136,578 | $1,242,214 |
| 16 | Milpitas | 19.00 | 78,578 | $178,798 | $1,502,891 |
| 17 | Millbrae | 19.14 | 22,689 | $163,476 | $2,082,465 |
| 18 | Burlingame | 20.00 | 30,525 | $174,000 | $2,761,630 |
| 19 | Campbell | 20.29 | 42,781 | $145,268 | $1,977,422 |
| 20 | Moraga | 20.43 | 16,769 | $216,193 | $1,666,830 |
| 21 | Belmont | 20.64 | 27,337 | $205,297 | $2,332,686 |
| 22 | Livermore | 20.86 | 85,522 | $160,775 | $1,122,823 |
| 23 | Pleasanton | 21.79 | 76,960 | $190,124 | $1,601,646 |
| 24 | Menlo Park | 22.57 | 32,727 | $210,025 | $2,865,159 |
| 25 | San Ramon | 23.50 | 85,993 | $196,161 | $1,543,534 |
| 26 | Sunnyvale | 24.29 | 154,236 | $186,170 | $2,168,909 |
| 27 | Mountain View | 24.93 | 83,732 | $189,917 | $2,037,086 |
| 28 | Dublin | 25.07 | 70,803 | $214,385 | $1,305,295 |
| 29 | Palo Alto | 26.14 | 67,237 | $231,101 | $3,722,200 |
| 30 | Danville | 26.36 | 43,401 | $232,216 | $1,908,521 |
| 31 | Los Gatos | 28.07 | 32,786 | $217,554 | $2,705,289 |
| 32 | Monte Sereno | 28.21 | 3,461 | $250,001 | $2,108,567 |
| 33 | Hillsborough | 28.57 | 11,099 | $250,001 | $5,279,135 |
| 34 | Lafayette | 29.64 | 25,285 | $228,250 | $1,934,581 |
| 35 | Portola Valley | 30.07 | 4,305 | $250,001 | $4,275,093 |
| 36 | Los Altos Hills | 30.93 | 8,377 | $250,001 | $6,102,345 |
| 37 | Atherton | 31.29 | 6,993 | $250,001 | $7,890,841 |
| 38 | San Carlos | 31.50 | 29,614 | $237,470 | $2,459,877 |
| 39 | Cupertino | 32.21 | 58,566 | $234,707 | $3,189,452 |
| 40 | Orinda | 32.29 | 19,514 | $250,001 | $1,985,117 |
| 41 | Woodside | 32.36 | 5,126 | $250,001 | $3,891,384 |
| 42 | Los Altos | 33.07 | 30,698 | $250,001 | $4,713,315 |
| 43 | Saratoga | 34.14 | 30,319 | $250,001 | $4,189,623 |
| 44 | Piedmont | 38.14 | 10,945 | $250,001 | $2,459,056 |
Source: U.S. Census ACS 2020-2024. 44 suburbs within 30 miles of Fremont.
Summary
Summary: The areas around Fremont where the dream is more of a nightmare for 2026
Well there you have it — the worst of the ‘burbs surrounding Fremont with Hayward casting itself ahead of the pack.
The worst suburbs of Fremont are Hayward, Oakland, San Leandro, East Palo Alto, Brisbane, San Jose, Walnut Creek, San Bruno, Alameda, and Santa Clara.
As we mentioned earlier, the suburbs around Fremont aren’t all bad. Piedmont takes the cake as the best place to live around Fremont. Not sold on California? Take the two-minute Find Your Place quiz and see which state actually fits you.
Questions and answers
Worst Suburbs Of Fremont FAQs
What is the worst suburb of Fremont?
Hayward ranks as the worst suburb around Fremont for 2026, according to Saturday Night Science. Oakland and San Leandro are next on the list.
What are the worst suburbs of Fremont?
The worst-ranked suburbs around Fremont are Hayward, Oakland, San Leandro, East Palo Alto, Brisbane, San Jose, Walnut Creek, San Bruno, Alameda, and Santa Clara. We scored all 44 places within 30 miles.
Why does Hayward rank as the worst suburb?
Hayward posts the roughest combined numbers of the 44 suburbs we scored: a median household income of $113,318, a median home value of $848,427, and a poverty rate of 9.6%.
What is the best-ranked suburb near Fremont?
Piedmont lands at the opposite end of this ranking, making it the best-ranked suburb near Fremont by these measures. Our separate best suburbs of Fremont list covers that side properly.
How do you rank the worst suburbs?
Suburbs are scored on unemployment, income, density, home values, dropouts, poverty, and insurance coverage, using Census American Community Survey data. Real numbers, light heart — every one of these towns has people making it work.