Compare San Jose to…
San Jose SnackAbility
Overall SnackAbility
Crime in San Jose summary. We use data from the FBI to determine the crime rates in San Jose. Key points include:
There were 30,568 total crimes in San Jose in the last reporting year.
The overall crime rate per 100,000 people in San Jose is 3,194.7 / 100k people.
The violent crime rate per 100,000 people in San Jose is 606.8 / 100k people.
The property crime rate per 100,000 people in San Jose is 2,587.9 / 100k people.
Overall, crime in San Jose is 50.75% above the national average.
Total Crimes
Above National Average
Crime In San Jose Comparison Table
| Statistic | Count Raw |
San Jose / 100k People |
California / 100k People |
National / 100k People |
|---|---|---|---|---|
| Total Crimes Per 100K | 30,568 | 3,194.7 | 2,564.5 | 2,119.2 |
| Violent Crime | 5,806 | 606.8 | 486.0 | 359.0 |
| Murder | 26 | 2.7 | 4.5 | 5.0 |
| Robbery | 1,347 | 140.8 | 119.1 | 61.0 |
| Aggravated Assault | 3,693 | 386.0 | 325.8 | 256.0 |
| Property Crime | 24,762 | 2,587.9 | 2,078.4 | 1,760.0 |
| Burglary | 4,086 | 427.0 | 305.8 | 229.0 |
| Larceny | 14,575 | 1,523.2 | 1,345.2 | 1,272.0 |
| Car Theft | 6,101 | 637.6 | 427.5 | 259.0 |
Source: FBI Uniform Crime Reporting (2024)
Cost of living in San Jose summary. We use data on the cost of living to determine how expensive it is to live in San Jose. Real estate prices drive most of the variance in cost of living around California. Key points include:
The cost of living in San Jose is 216 with 100 being average.
The cost of living in San Jose is 2.2x higher than the national average.
The median home value in San Jose is $1,463,614.
The median income in San Jose is $146,427.
San Jose's Overall Cost Of Living
Higher Than The National Average
Cost Of Living In San Jose Comparison Table
| Living Expense | San Jose | California | National Average |
|---|---|---|---|
| Overall | 216 | 142 | 100 |
| Services | 119 | 110 | 100 |
| Groceries | 125 | 118 | 100 |
| Health | 425 | 197 | 100 |
| Housing | 135 | 120 | 100 |
| Transportation | 132 | 121 | 100 |
| Utilities | 136 | 121 | 100 |
Source: Cost of living index, normalized to US average = 100
San Jose, CA Weather
The average high in San Jose is 71.1° and the average low is 48.8°.
There are 37.9 days of precipitation each year.
Expect an average of 17.4 inches of precipitation each year with 1.6 inches of snow.
| Stat | San Jose |
|---|---|
| Average Annual High | 71.1 |
| Average Annual Low | 48.8 |
| Annual Precipitation Days | 37.9 |
| Average Annual Precipitation | 17.4 |
| Average Annual Snowfall | 1.6 |
Average High
Days of Rain
Source: NOAA climate normals (30-year)
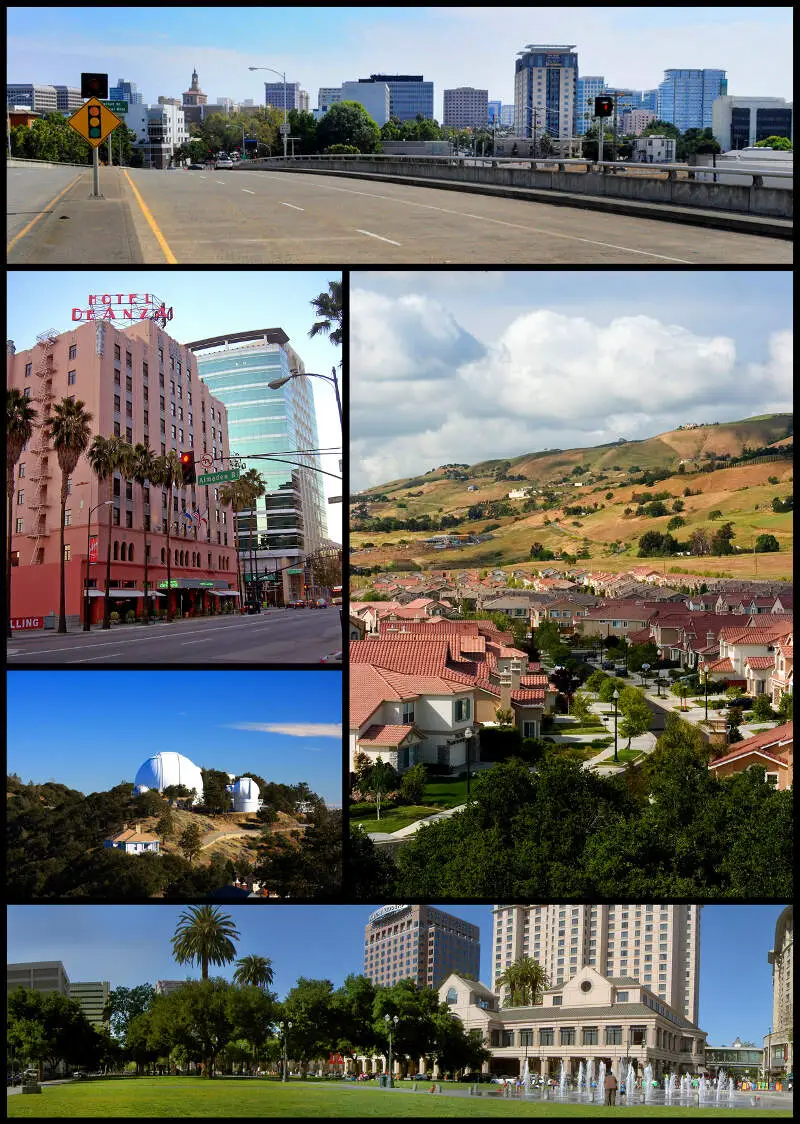
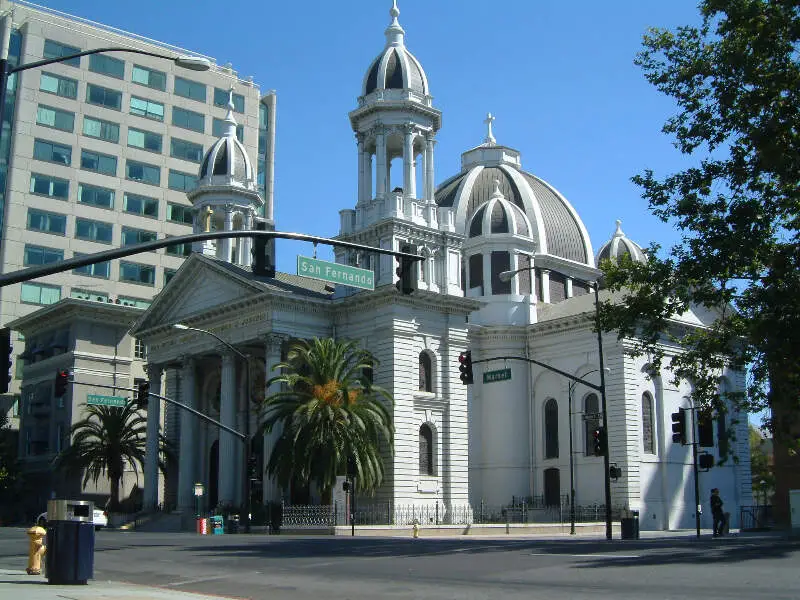
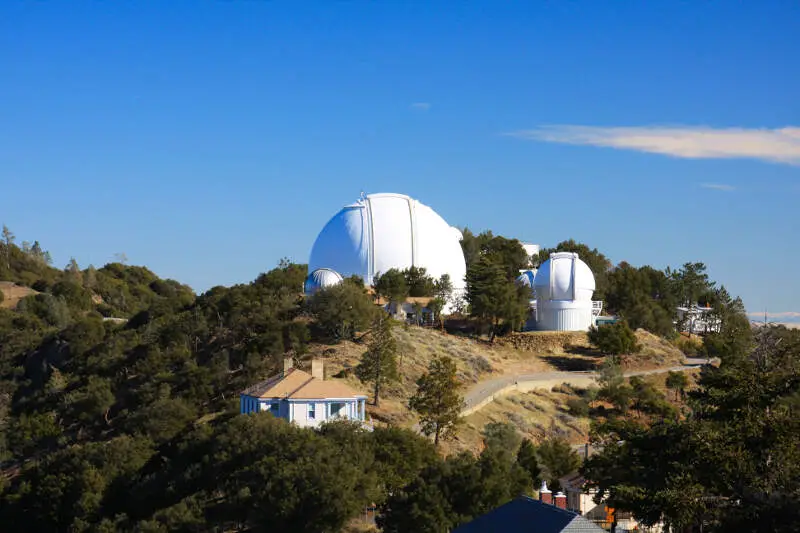
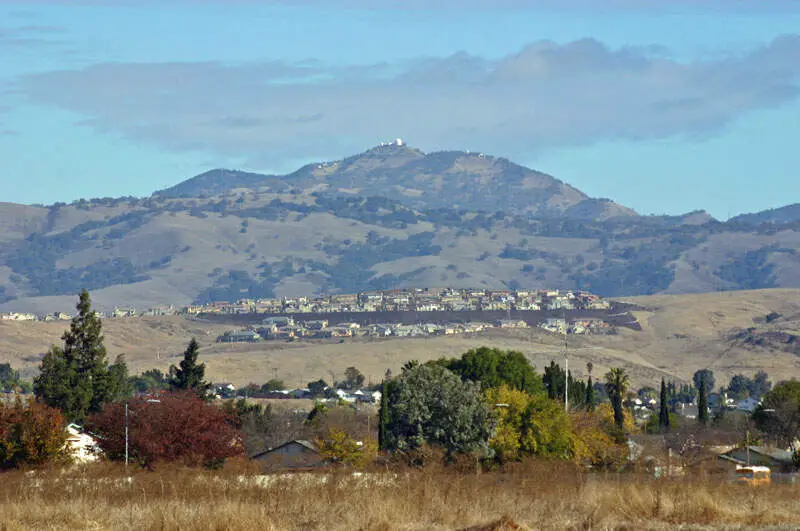
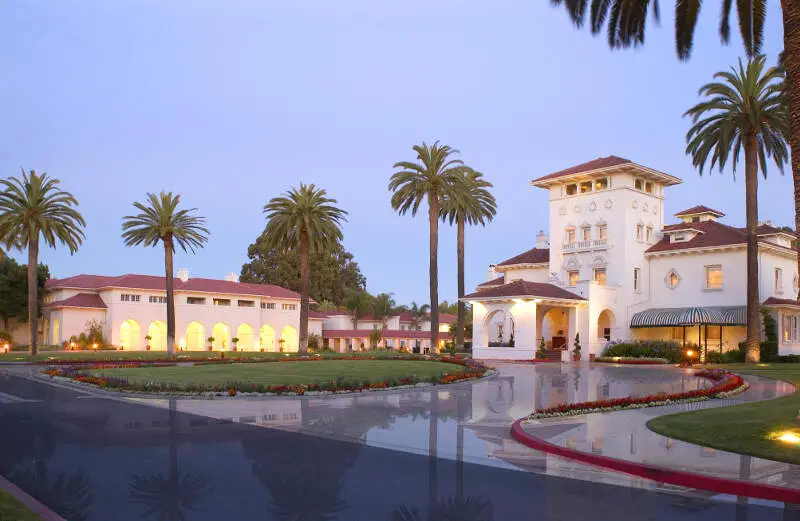
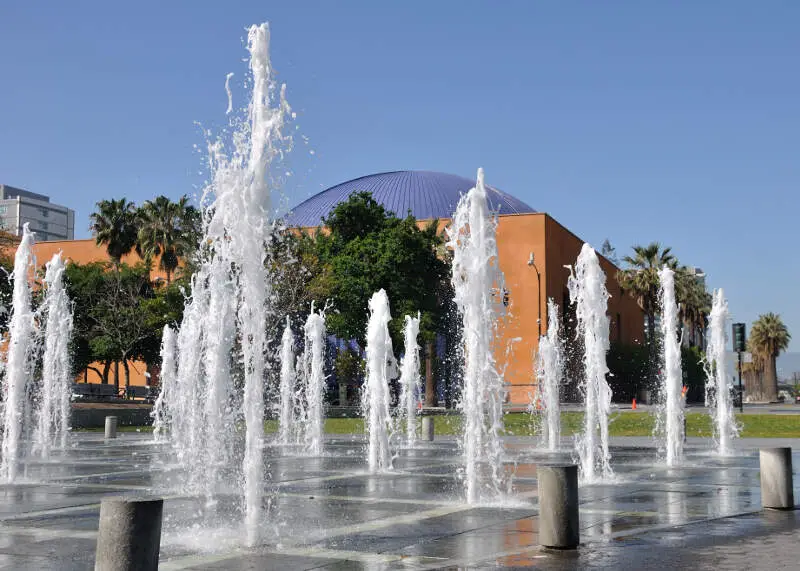
San Jose, CA Photos
2 Reviews & Comments About San Jose

I love the library of san jose, there are a lot of book in different language juste like the people in this city.
santana row is my favorite place, a lot of store, restaurants, large place, easy to park beautiful place to hang out with friends or family.
The crime is very low if you are away from the east side. Even then, for a continually growing city of over 1 million. The local sports team is major league hockey so during hockey season, there is a lot of excitement going on in downtown. Culturally, there is a good mixture of all ethnicity so food selection is diverse. As more people move in for job opportunities due to the tech industry, traffic is getting worse and worse. Most people are here for the jobs and weather.
The thing that will be shocking about the place is the cost of living. A decent house will cost upward of a million dollars. Living here is a struggle unless you make a lot of money. Everything is expensive, especially rent. If you live anywhere near a big tech firm, prepare to pay a lot for that luxury. As mentioned before, traffic is a nightmare. Going anywhere during rush hour and on major freeways like the 101 will take forever. Due to property prices, many have no choice but to commute and sit in traffic - adding an extra 1-2 hours to their workday.
Rankings & Articles For San Jose


Locations Around San Jose
Map Of San Jose, CA
Best Places Around San Jose
East Foothills, CA
Population 7,139
Cupertino, CA
Population 58,566
Los Altos, CA
Population 30,698
Sunnyvale, CA
Population 154,236
Santa Clara, CA
Population 130,256
Mountain View, CA
Population 83,732
Saratoga, CA
Population 30,319
Campbell, CA
Population 42,781
Milpitas, CA
Population 78,578
Palo Alto, CA
Population 67,237
San Jose Demographics And Statistics
Population over time in San Jose
The current population in San Jose is 990,138. The population has increased 7.0% from 2010.
| Year | Population | % Change |
|---|---|---|
| 2024 | 990,138 | 0.0% |
| 2023 | 990,054 | -1.1% |
| 2022 | 1,001,176 | -1.2% |
| 2021 | 1,013,337 | -1.6% |
| 2020 | 1,029,409 | 0.2% |
| 2019 | 1,027,690 | 0.1% |
| 2018 | 1,026,658 | 0.4% |
| 2017 | 1,023,031 | 1.4% |
| 2016 | 1,009,363 | 0.8% |
| 2015 | 1,000,860 | 1.5% |
| 2014 | 986,320 | 1.8% |
| 2013 | 968,903 | 1.5% |
| 2012 | 954,379 | 1.6% |
| 2011 | 939,688 | 1.6% |
| 2010 | 925,300 | - |
Race / Ethnicity in San Jose
See the full breakdown
San Jose is:
22.3% White with 220,650 White residents.
2.7% African American with 27,099 African American residents.
0.2% American Indian with 2,248 American Indian residents.
39.2% Asian with 388,267 Asian residents.
0.5% Hawaiian with 4,530 Hawaiian residents.
0.5% Other with 5,082 Other residents.
3.8% Two Or More with 37,274 Two Or More residents.
30.8% Hispanic with 304,988 Hispanic residents.
| Race | San Jose | CA | USA |
|---|---|---|---|
| White | 22.3% | 33.8% | 57.4% |
| African American | 2.7% | 5.2% | 11.9% |
| American Indian | 0.2% | 0.3% | 0.5% |
| Asian | 39.2% | 15.3% | 5.9% |
| Hawaiian | 0.5% | 0.3% | 0.2% |
| Other | 0.5% | 0.6% | 0.6% |
| Two Or More | 3.8% | 4.4% | 4.3% |
| Hispanic | 30.8% | 40.2% | 19.3% |
Gender in San Jose
See the full breakdown
San Jose is 49.1% female with 486,467 female residents.
San Jose is 50.9% male with 503,670 male residents.
| Gender | San Jose | CA | USA |
|---|---|---|---|
| Female | 49.1% | 50.1% | 50.5% |
| Male | 50.9% | 49.9% | 49.5% |
Highest level of educational attainment in San Jose for adults over 25
See the full breakdown
9.0% of adults in San Jose completed < 9th grade.
6.0% of adults in San Jose completed 9-12th grade.
16.0% of adults in San Jose completed high school / ged.
15.0% of adults in San Jose completed some college.
7.0% of adults in San Jose completed associate's degree.
26.0% of adults in San Jose completed bachelor's degree.
16.0% of adults in San Jose completed master's degree.
2.0% of adults in San Jose completed professional degree.
3.0% of adults in San Jose completed doctorate degree.
| Education | San Jose | CA | USA |
|---|---|---|---|
| < 9th Grade | 9.0% | 8.0% | 4.0% |
| 9-12th Grade | 6.0% | 7.0% | 6.0% |
| High School / GED | 16.0% | 20.0% | 26.0% |
| Some College | 15.0% | 19.0% | 19.0% |
| Associate's Degree | 7.0% | 8.0% | 9.0% |
| Bachelor's Degree | 26.0% | 23.0% | 22.0% |
| Master's Degree | 16.0% | 10.0% | 10.0% |
| Professional Degree | 2.0% | 3.0% | 2.0% |
| Doctorate Degree | 3.0% | 2.0% | 2.0% |
Household Income For San Jose, California
See the full breakdown
3.0% of households in San Jose earn Less than $10,000.
2.2% of households in San Jose earn $10,000 to $14,999.
3.5% of households in San Jose earn $15,000 to $24,999.
3.5% of households in San Jose earn $25,000 to $34,999.
5.1% of households in San Jose earn $35,000 to $49,999.
8.8% of households in San Jose earn $50,000 to $74,999.
9.3% of households in San Jose earn $75,000 to $99,999.
15.6% of households in San Jose earn $100,000 to $149,999.
13.0% of households in San Jose earn $150,000 to $199,999.
36.0% of households in San Jose earn $200,000 or more.
| Income | San Jose | CA | USA |
|---|---|---|---|
| Less than $10,000 | 3.0% | 4.5% | 5.0% |
| $10,000 to $14,999 | 2.2% | 2.9% | 3.4% |
| $15,000 to $24,999 | 3.5% | 5.0% | 6.3% |
| $25,000 to $34,999 | 3.5% | 5.3% | 6.6% |
| $35,000 to $49,999 | 5.1% | 8.1% | 10.1% |
| $50,000 to $74,999 | 8.8% | 13.0% | 15.5% |
| $75,000 to $99,999 | 9.3% | 11.6% | 12.6% |
| $100,000 to $149,999 | 15.6% | 17.8% | 17.5% |
| $150,000 to $199,999 | 13.0% | 11.3% | 9.6% |
| $200,000 or more | 36.0% | 20.5% | 13.4% |
Source: U.S. Census ACS 5-year estimates (2024)


