Half Moon Bay SnackAbility
Overall SnackAbility
Cost of living in Half Moon Bay summary. We use data on the cost of living to determine how expensive it is to live in Half Moon Bay. Real estate prices drive most of the variance in cost of living around California. Key points include:
The cost of living in Half Moon Bay is 227 with 100 being average.
The cost of living in Half Moon Bay is 2.3x higher than the national average.
The median home value in Half Moon Bay is $1,573,307.
The median income in Half Moon Bay is $157,884.
Half Moon Bay's Overall Cost Of Living
Higher Than The National Average
Cost Of Living In Half Moon Bay Comparison Table
| Living Expense | Half Moon Bay | California | National Average |
|---|---|---|---|
| Overall | 227 | 142 | 100 |
| Services | 113 | 110 | 100 |
| Groceries | 113 | 118 | 100 |
| Health | 496 | 197 | 100 |
| Housing | 117 | 120 | 100 |
| Transportation | 116 | 121 | 100 |
| Utilities | 117 | 121 | 100 |
Source: Cost of living index, normalized to US average = 100
Half Moon Bay, CA Weather
The average high in Half Moon Bay is 66.7° and the average low is 49.1°.
There are 42.7 days of precipitation each year.
Expect an average of 24.5 inches of precipitation each year with 0.0 inches of snow.
| Stat | Half Moon Bay |
|---|---|
| Average Annual High | 66.7 |
| Average Annual Low | 49.1 |
| Annual Precipitation Days | 42.7 |
| Average Annual Precipitation | 24.5 |
| Average Annual Snowfall | 0.0 |
Average High
Days of Rain
Source: NOAA climate normals (30-year)
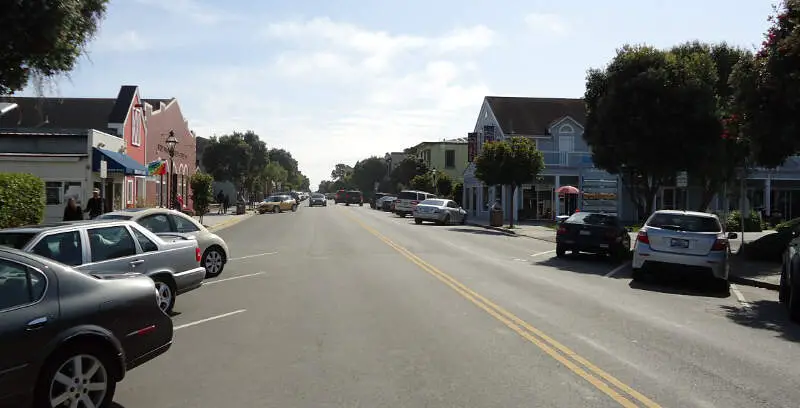
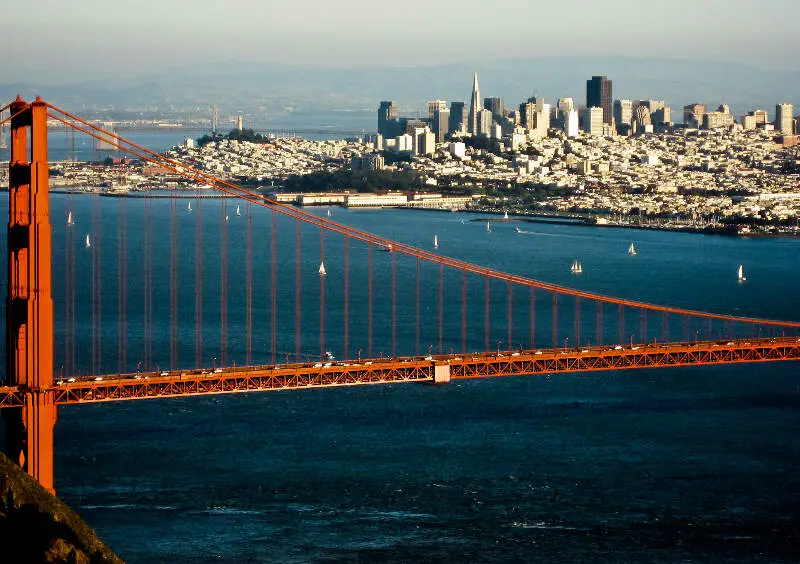
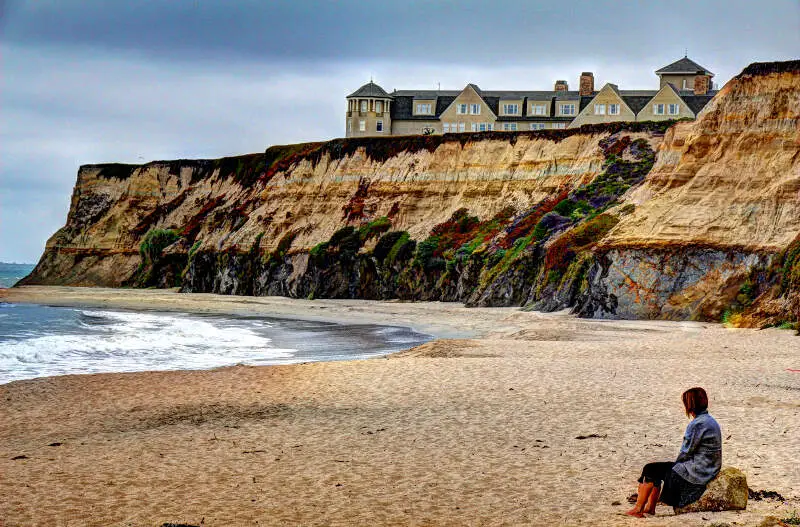
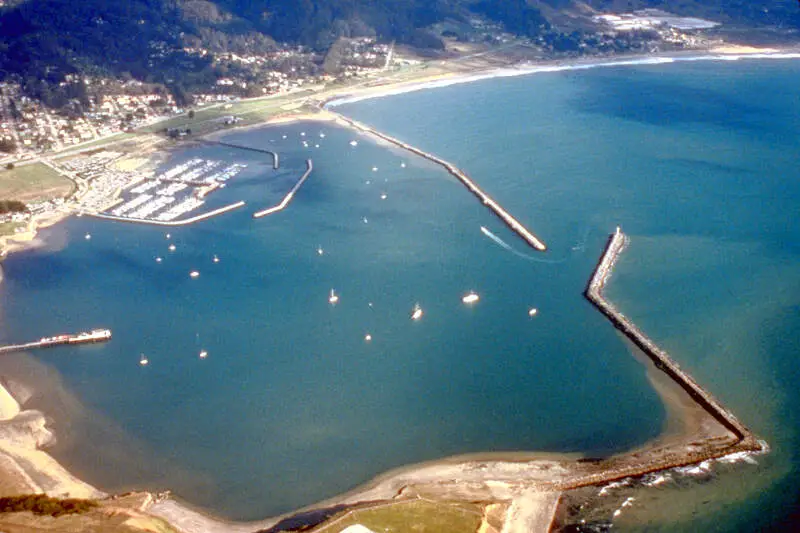
Half Moon Bay, CA Photos


Rankings & Articles For Half Moon Bay


Locations Around Half Moon Bay
Map Of Half Moon Bay, CA
Best Places Around Half Moon Bay
San Carlos, CA
Population 29,614
San Mateo, CA
Population 103,105
San Bruno, CA
Population 42,307
Belmont, CA
Population 27,337
North Fair Oaks, CA
Population 13,100
Millbrae, CA
Population 22,689
Menlo Park, CA
Population 32,727
South San Francisco, CA
Population 64,305
Burlingame, CA
Population 30,525
Pacifica, CA
Population 37,261
Half Moon Bay Demographics And Statistics
Population over time in Half Moon Bay
The current population in Half Moon Bay is 11,391. The population has increased 2.4% from 2010.
| Year | Population | % Change |
|---|---|---|
| 2024 | 11,391 | -0.6% |
| 2023 | 11,454 | -1.5% |
| 2022 | 11,633 | -1.3% |
| 2021 | 11,792 | -6.3% |
| 2020 | 12,583 | -2.0% |
| 2019 | 12,834 | 1.0% |
| 2018 | 12,706 | 1.1% |
| 2017 | 12,565 | 2.3% |
| 2016 | 12,281 | 1.9% |
| 2015 | 12,052 | 2.1% |
| 2014 | 11,803 | 2.1% |
| 2013 | 11,555 | 1.6% |
| 2012 | 11,372 | 1.3% |
| 2011 | 11,228 | 0.9% |
| 2010 | 11,126 | - |
Race / Ethnicity in Half Moon Bay
See the full breakdown
Half Moon Bay is:
58.4% White with 6,655 White residents.
0.5% African American with 56 African American residents.
0.0% American Indian with 0 American Indian residents.
6.0% Asian with 685 Asian residents.
0.0% Hawaiian with 0 Hawaiian residents.
0.0% Other with 0 Other residents.
6.4% Two Or More with 730 Two Or More residents.
28.7% Hispanic with 3,265 Hispanic residents.
| Race | Half Moon Bay | CA | USA |
|---|---|---|---|
| White | 58.4% | 33.8% | 57.4% |
| African American | 0.5% | 5.2% | 11.9% |
| American Indian | 0.0% | 0.3% | 0.5% |
| Asian | 6.0% | 15.3% | 5.9% |
| Hawaiian | 0.0% | 0.3% | 0.2% |
| Other | 0.0% | 0.6% | 0.6% |
| Two Or More | 6.4% | 4.4% | 4.3% |
| Hispanic | 28.7% | 40.2% | 19.3% |
Gender in Half Moon Bay
See the full breakdown
Half Moon Bay is 52.2% female with 5,946 female residents.
Half Moon Bay is 47.8% male with 5,445 male residents.
| Gender | Half Moon Bay | CA | USA |
|---|---|---|---|
| Female | 52.2% | 50.1% | 50.5% |
| Male | 47.8% | 49.9% | 49.5% |
Highest level of educational attainment in Half Moon Bay for adults over 25
See the full breakdown
8.0% of adults in Half Moon Bay completed < 9th grade.
2.0% of adults in Half Moon Bay completed 9-12th grade.
12.0% of adults in Half Moon Bay completed high school / ged.
16.0% of adults in Half Moon Bay completed some college.
10.0% of adults in Half Moon Bay completed associate's degree.
26.0% of adults in Half Moon Bay completed bachelor's degree.
19.0% of adults in Half Moon Bay completed master's degree.
4.0% of adults in Half Moon Bay completed professional degree.
3.0% of adults in Half Moon Bay completed doctorate degree.
| Education | Half Moon Bay | CA | USA |
|---|---|---|---|
| < 9th Grade | 8.0% | 8.0% | 4.0% |
| 9-12th Grade | 2.0% | 7.0% | 6.0% |
| High School / GED | 12.0% | 20.0% | 26.0% |
| Some College | 16.0% | 19.0% | 19.0% |
| Associate's Degree | 10.0% | 8.0% | 9.0% |
| Bachelor's Degree | 26.0% | 23.0% | 22.0% |
| Master's Degree | 19.0% | 10.0% | 10.0% |
| Professional Degree | 4.0% | 3.0% | 2.0% |
| Doctorate Degree | 3.0% | 2.0% | 2.0% |
Household Income For Half Moon Bay, California
See the full breakdown
2.4% of households in Half Moon Bay earn Less than $10,000.
0.5% of households in Half Moon Bay earn $10,000 to $14,999.
4.7% of households in Half Moon Bay earn $15,000 to $24,999.
2.9% of households in Half Moon Bay earn $25,000 to $34,999.
5.5% of households in Half Moon Bay earn $35,000 to $49,999.
7.9% of households in Half Moon Bay earn $50,000 to $74,999.
7.4% of households in Half Moon Bay earn $75,000 to $99,999.
14.0% of households in Half Moon Bay earn $100,000 to $149,999.
18.3% of households in Half Moon Bay earn $150,000 to $199,999.
36.4% of households in Half Moon Bay earn $200,000 or more.
| Income | Half Moon Bay | CA | USA |
|---|---|---|---|
| Less than $10,000 | 2.4% | 4.5% | 5.0% |
| $10,000 to $14,999 | 0.5% | 2.9% | 3.4% |
| $15,000 to $24,999 | 4.7% | 5.0% | 6.3% |
| $25,000 to $34,999 | 2.9% | 5.3% | 6.6% |
| $35,000 to $49,999 | 5.5% | 8.1% | 10.1% |
| $50,000 to $74,999 | 7.9% | 13.0% | 15.5% |
| $75,000 to $99,999 | 7.4% | 11.6% | 12.6% |
| $100,000 to $149,999 | 14.0% | 17.8% | 17.5% |
| $150,000 to $199,999 | 18.3% | 11.3% | 9.6% |
| $200,000 or more | 36.4% | 20.5% | 13.4% |
Source: U.S. Census ACS 5-year estimates (2024)


