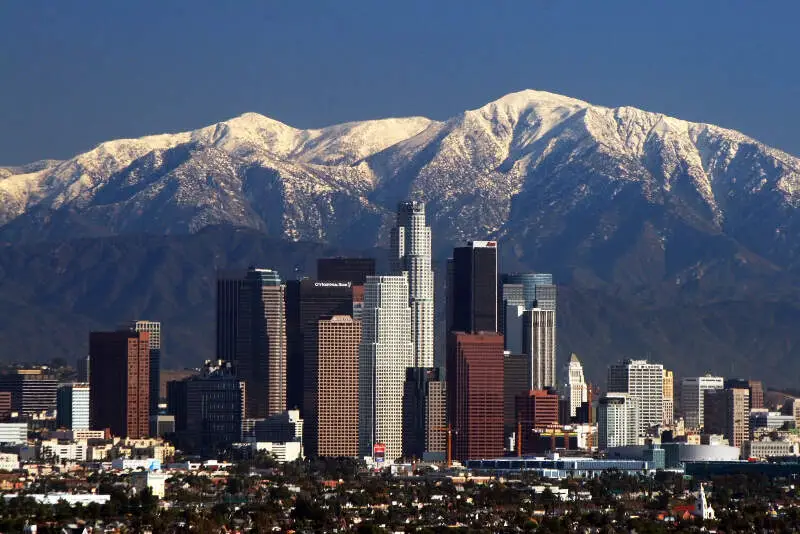
It’s not all sunshine and movie stars in Los Angeles, the City of Angels has some pretty sketch neighborhoods, too.
Just how bad are these neighborhoods? Well, you’re going to have to take a look below at RoadSnacks’ list of the worst neighborhoods in Los Angeles for 2025 to see where the crime is high and the average income is low. We call this the perfect storm.
But in order to determine Los Angeles’ worst neighborhoods, we had to give each neighborhood an actual concrete score: we call this a neighborhood’s overall ‘Snackability’. To get this score, we looked at the latest census data on income levels, unemployment rates, crime, and home prices for 83 Los Angeles neighborhoods with over 0 residents. Incidentally, this is our tenth time ranking Los Angeles’ worst neighborhoods, so trust us when we say that these are the worst of the worst.
Folks, the kind of places that we are talking about are the kind of places that you’ll want to invest in a security system or a guard dog. And in all honesty, if you find that one of Los Angeles’ worst neighborhoods is all that you can afford, you might want to think about renting: save yourself the headache.
And because the glass is always half full here a RoadSnacks, we think that If you do get stuck in one of Los Angeles’ worst neighborhoods, it might not be all bad. Heck, you could be front and center to a real life Cops episode in Watts and/or you could get some practice talking yourself out of sticky situations if you live Downtown.
So, want to know what Los Angeles’ neighborhoods you should avoid if you value your life? Keep reading.
Table Of Contents: Top 10 | Methodology | Summary | Table
Sadly, Los Angeles’ worst neighborhoods have carjackings happening in broad daylight, daily robberies, and plenty of violent crimes. There are currently 12,000 police officers that patrol Tinseltown, but the city houses 4 million residents. Law enforcement is doing their best to clean up the city’s worst neighborhoods, but they can’t be everywhere. As a result, places like Hollywood are starting to see the negative effects.
So, what’s the worst neighborhood in Los Angeles for 2025? The worst neighborhood in Los Angeles would be Fashion District according to the most recent data.
To see how the rest of Los Angeles’ neighborhoods faired, take a look at the list below; and if you don’t see what you’re looking for there, head to the bottom.
For more California reading, check out:
- Best Places To Live In California
- Cheapest Places To Live In California
- Most Dangerous Cities In California
The 10 Most Dangerous Neighborhoods In Los Angeles For 2025
/10
Population: 2,466
Violent Crimes Per 100k: 1,214
Property Crime Per 100k: 4,215
Median Home Value: $89,350 (worst)
Median Income: $39,866 (3rd worst)
More on Fashion District: Data
Where’s the worst neighborhood in Los Angeles? That would be the Fashion District.
There’s only about 2,466 people packed into this little hood, but all of them are broke. The Fashion District is the most dangerous part of LA, too, where you might just get blown away for wearing the wrong hat.
Homes here cost about $89,350 for a reason. Think about that. It’s 4 times more expensive to live in Watts than in the Fashion District neighborhood. Can we interest anyone in a $89,350 house in the Fashion District? No? Okay then.
The Fashion District kinda resembles a third world country in some blocks. You’d better be careful walking through this neighborhood in the day, and maybe reconsider at night.
/10
Population: 7,245
Violent Crimes Per 100k: 1,212
Property Crime Per 100k: 4,208
Median Home Value: $218,186 (3rd worst)
Median Income: $29,771 (worst)
More on Wholesale District-Skid Row: Data
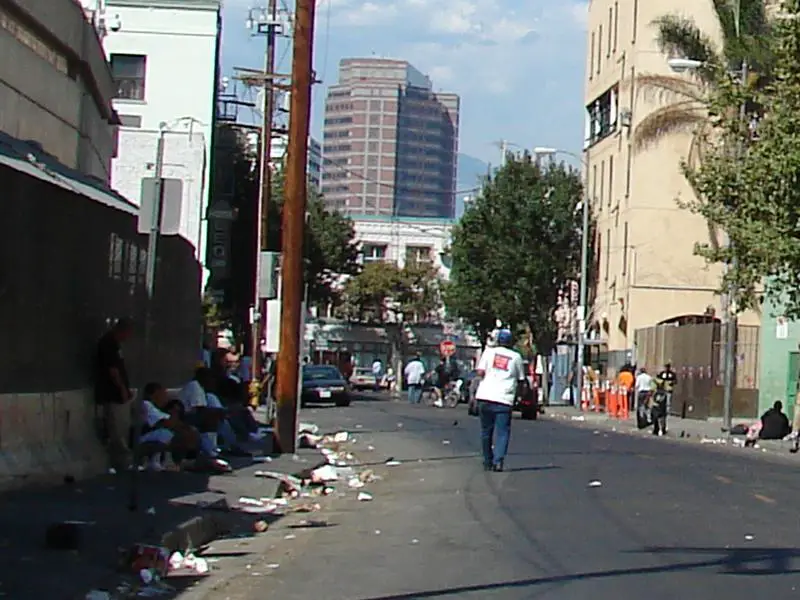
Believe it or not, there’s actually a couple of LA neighborhoods that are actually worse than South Central, Skid Row and Watts. Take for instance the Wholesale District. Most people call it Skid Row.
You’ve probably been here before at one point or another if you’re from the LA area. It’s where the city of LA has basically allowed anyone and everyone to camp out and squat along several major streets, including San Pedro and South Los Angeles Streets.
It’s essentially one big permanent homeless encampment with poop everywhere. Not good. Not fun.
Some people come here to gawk at the area. Others accidentally make a wrong turn and wind up here. No matter what – lock your doors.
Now, the only real difference between Skid Row and the Wholesale District is a line on a map. However, the Wholesale District is technically even more dangerous and poor than Skid Row.
/10
Population: 10,458
Violent Crimes Per 100k: 2,314
Property Crime Per 100k: 5,507
Median Home Value: $460,217 (15th worst)
Median Income: $51,933 (14th worst)
More on Leiment Park: Data
/10
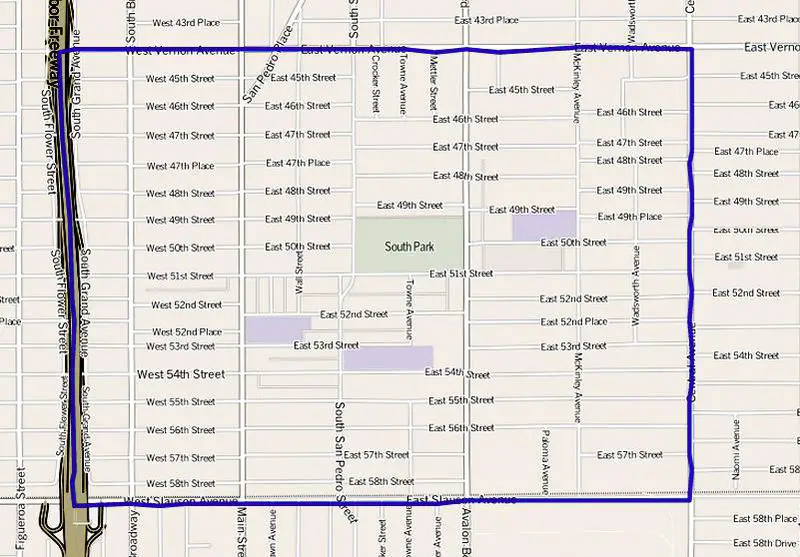
Population: 7,021
Violent Crimes Per 100k: 2,850
Property Crime Per 100k: 11,386
Median Home Value: $209,983 (2nd worst)
Median Income: $48,922 (7th worst)
More on South Park: Data
/10
Population: 8,572
Violent Crimes Per 100k: 2,390
Property Crime Per 100k: 7,754
Median Home Value: $647,575 (42nd worst)
Median Income: $81,139 (45th worst)
More on Montecito Heights: Data
/10
Population: 3,457
Violent Crimes Per 100k: 3,085
Property Crime Per 100k: 10,429
Median Home Value: $306,133 (5th worst)
Median Income: $55,760 (20th worst)
More on Civic Center-Little Tokyo: Data
/10
Population: 57,489
Violent Crimes Per 100k: 1,315
Property Crime Per 100k: 3,332
Median Home Value: $440,243 (11th worst)
Median Income: $43,878 (4th worst)
More on Central City: Data
/10
Population: 40,431
Violent Crimes Per 100k: 1,704
Property Crime Per 100k: 2,436
Median Home Value: $354,525 (6th worst)
Median Income: $36,669 (2nd worst)
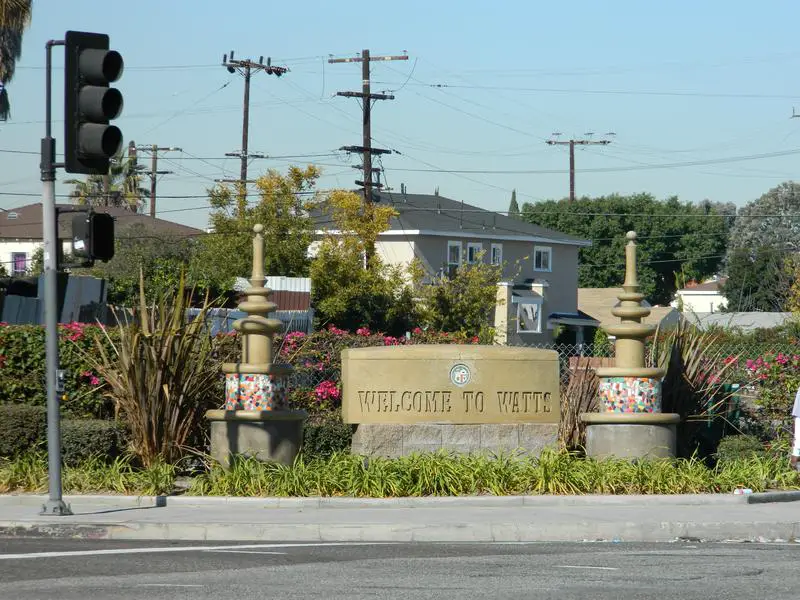
More on Watts: Data
Watts is a notoriously horrible place you can live in the greater LA area.
Wanna play a joke on your friends? Tell them you’re going to a party in Watts tonight and watch their reaction.
This neighborhood, located just north of the 105 on Compton Boulevard, is basically a one big housing project. Things are so bad in Watts that this neighborhood has a Wikipedia entry. And a very lengthy one at that.
Believe it or not, but an average home in Watts actually costs $354,525. In most places in America, $354,525 gets you a really nice home in a pretty decent neighborhood. In Watts, that gets you a single story, 1200 square foot dump with bullet hole patches on it. This is one of many LA areas made famous by mid 90’s hip hop gangster rappers like TuPac, Snoop Dogg and Dr Dre, who featured Watts in songs like California Love.
They’ve tried to make Watts better. Every year there’s a “Toys for Watts” toy drive, a “Watts Summer Games” event, and even a Watts Christmas parade.
/10
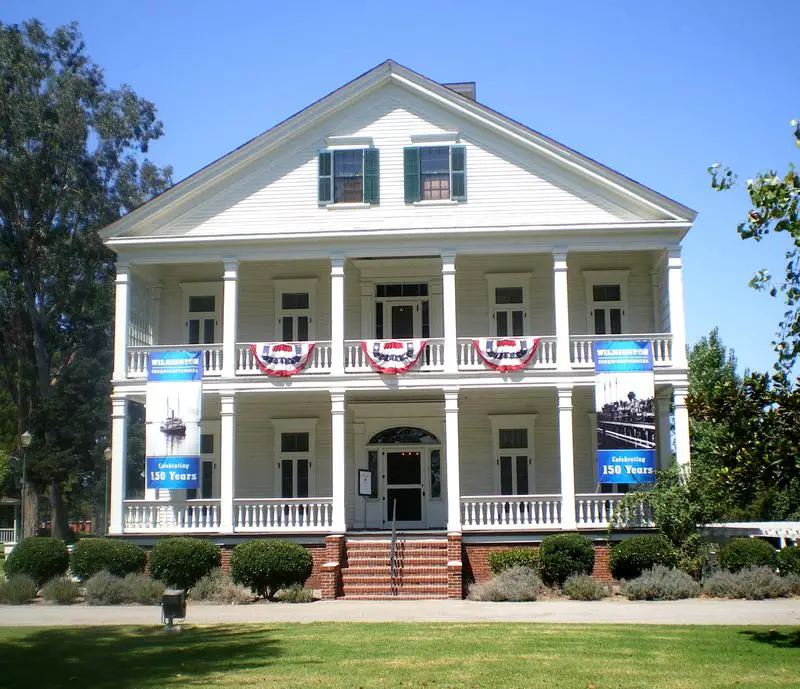
Population: 50,695
Violent Crimes Per 100k: 799
Property Crime Per 100k: 2,743
Median Home Value: $437,323 (10th worst)
Median Income: $56,607 (2worst)
More on Wilmington: Data
/10
Population: 10,713
Violent Crimes Per 100k: 772
Property Crime Per 100k: 3,193
Median Home Value: $578,810 (33rd worst)
Median Income: $58,239 (26th worst)
More on Cypress Park: Data
Methodology: How we determined the most dangerous Los Angeles neighborhoods in 2025
To figure out how bad a place is to live in, we only needed to know what kinds of things people like and then decide what places have the least amount of those things. We plugged the following criteria into Saturday Night Science to get the worst neighborhoods in Los Angeles:
- High crime (Estimated)
- High unemployment (Less jobs)
- Low median income (Less pay)
- Low population density (No things to do)
- Low home values (No one’s willing to pay to live here)
Then, we ranked each neighborhood in Los Angeles, California for each of these criteria from worst to best.
Next, we averaged the individual rankings for each criterion into a “Worst Score.”
The neighborhood with the lowest “Worst Score” ranks as the most dangerous neighborhood of Los Angeles.
The article is an opinion based on facts and is meant as infotainment. We updated this article for 2025. This report is our time ranking the worst neighborhoods to live in Los Angeles.
Skip to the end to see the list of all 83 neighborhoods ranked from worst to best.
Summary: The Worst Neighborhoods Around Los Angeles
Well, there you have it — the worst of the neighborhoods in Los Angeles with Fashion District landing at the bottom of the pack.
The worst neighborhoods in Los Angeles are Fashion District, Wholesale District-Skid Row, Leiment Park, South Park, Montecito Heights, Civic Center-Little Tokyo, Central City, Watts, Wilmington, and Cypress Park.
As mentioned earlier, the neighborhoods in Los Angeles aren’t all bad. Mar Vista takes the cake as the best place to live in Los Angeles.
The best neighborhoods in Los Angeles are Mar Vista, Brentwood, Pacific Palisades, Palms, and Bel Air.
We ranked the neighborhoods from worst to best in the chart below.
For more California reading, check out:
Most Dangerous Neighborhoods To Live In Los Angeles For 2025?
| Rank | Neighborhood | Population | Home Value | Median Income |
|---|---|---|---|---|
| 1 | Fashion District | 2,466 | $89,350 | $39,866 |
| 2 | Wholesale District-Skid Row | 7,245 | $218,186 | $29,771 |
| 3 | Leiment Park | 10,458 | $460,217 | $51,933 |
| 4 | South Park | 7,021 | $209,983 | $48,922 |
| 5 | Montecito Heights | 8,572 | $647,575 | $81,139 |
| 6 | Civic Center-Little Tokyo | 3,457 | $306,133 | $55,760 |
| 7 | Central City | 57,489 | $440,243 | $43,878 |
| 8 | Watts | 40,431 | $354,525 | $36,669 |
| 9 | Wilmington | 50,695 | $437,323 | $56,607 |
| 10 | Cypress Park | 10,713 | $578,810 | $58,239 |
| 11 | Southeast Los Angeles | 194,788 | $410,964 | $45,171 |
| 12 | Hyde Park | 31,100 | $567,417 | $58,128 |
| 13 | Downtown | 45,198 | $704,691 | $50,463 |
| 14 | Chinatown | 9,144 | $488,417 | $53,225 |
| 15 | Harbor City | 22,398 | $456,657 | $63,462 |
| 16 | Glendale | 29 | $1,053,600 | $53,438 |
| 17 | South Los Angeles | 207,640 | $469,672 | $50,087 |
| 18 | New Downtown | 6,396 | $282,200 | $49,413 |
| 19 | Crenshaw | 25,072 | $642,111 | $51,584 |
| 20 | North Hollywood | 71,248 | $623,486 | $57,555 |
| 21 | Tujunga | 26,088 | $546,061 | $77,320 |
| 22 | Van Nuys | 109,844 | $545,731 | $58,231 |
| 23 | Lincoln Heights | 33,525 | $547,919 | $51,775 |
| 24 | Harbor Gateway | 42,327 | $554,804 | $67,380 |
| 25 | Canoga Park | 55,504 | $444,276 | $65,037 |
| 26 | Glassell Park | 23,038 | $711,482 | $76,170 |
| 27 | Boyle Heights | 77,778 | $472,252 | $49,528 |
| 28 | El Sereno | 44,421 | $556,110 | $66,447 |
| 29 | Winnetka | 50,815 | $542,476 | $75,166 |
| 30 | Central City East | 23,663 | $630,142 | $58,266 |
| 31 | Panorama City | 62,980 | $420,144 | $55,198 |
| 32 | Sunland | 16,555 | $551,050 | $91,974 |
| 33 | North Hills | 59,369 | $515,014 | $72,890 |
| 34 | Echo Park | 23,799 | $848,314 | $72,527 |
| 35 | Lakeview Terrace | 13,477 | $459,025 | $82,779 |
| 36 | Hollywood | 143,022 | $803,580 | $53,967 |
| 37 | Westlake | 98,864 | $755,085 | $46,523 |
| 38 | West Adams | 25,628 | $609,010 | $52,313 |
| 39 | Hollywood Hills | 31,163 | $1,232,129 | $113,863 |
| 40 | Valley Village | 28,134 | $837,730 | $84,571 |
| 41 | Sun Valley | 79,154 | $526,454 | $63,454 |
| 42 | Pacoima | 71,405 | $431,452 | $62,298 |
| 43 | Mission Hills | 21,378 | $497,623 | $84,609 |
| 44 | Studio City | 40,742 | $1,041,634 | $117,445 |
| 45 | Westchester | 36,173 | $1,001,476 | $129,931 |
| 46 | Sylmar | 78,715 | $471,372 | $78,184 |
| 47 | San Pedro | 77,099 | $609,528 | $77,474 |
| 48 | Toluca Lake | 9,150 | $890,544 | $83,615 |
| 49 | Chatsworth | 41,206 | $592,150 | $101,676 |
| 50 | Arleta | 39,928 | $500,739 | $84,270 |
| 51 | Beverly Glen | 12,053 | $1,705,700 | $193,885 |
| 52 | Mid City | 82,665 | $994,947 | $73,044 |
| 53 | Northridge | 82,432 | $622,194 | $94,583 |
| 54 | Reseda | 70,313 | $528,697 | $74,808 |
| 55 | Playa Del Ray | 16,056 | $873,850 | $104,607 |
| 56 | Woodland Hills | 77,392 | $762,283 | $109,058 |
| 57 | Silver Lake | 38,829 | $943,164 | $91,137 |
| 58 | Encino | 51,628 | $881,117 | $117,836 |
| 59 | Tarzana | 39,168 | $696,533 | $89,012 |
| 60 | Mount Washington | 18,109 | $739,788 | $89,732 |
| 61 | Shadow Hills | 4,677 | $719,933 | $100,458 |
| 62 | Highland Park | 45,611 | $685,910 | $73,793 |
| 63 | Granada Hills | 53,139 | $633,692 | $107,829 |
| 64 | Los Feliz | 28,163 | $1,174,050 | $101,089 |
| 65 | West Hills | 40,760 | $666,650 | $123,412 |
| 66 | Mid City West | 44,687 | $1,457,400 | $98,680 |
| 67 | Eagle Rock | 31,016 | $820,187 | $95,550 |
| 68 | Jefferson Park | 31,402 | $729,400 | $57,065 |
| 69 | Venice | 32,030 | $1,713,615 | $122,750 |
| 70 | West Los Angeles | 13,682 | $1,069,617 | $116,735 |
| 71 | Sawtelle | 34,435 | $807,986 | $92,728 |
| 72 | Atwater Village | 10,765 | $789,870 | $91,126 |
| 73 | Portar Ranch | 22,688 | $681,550 | $122,141 |
| 74 | Pico-Robertson | 18,291 | $1,296,346 | $103,804 |
| 75 | Westwood | 57,287 | $1,266,754 | $78,789 |
| 76 | Century City | 5,810 | $1,267,517 | $111,840 |
| 77 | Playa Vista | 8,485 | $1,225,967 | $151,877 |
| 78 | Mid Wilshire | 39,181 | $1,204,131 | $99,711 |
| 79 | Bel Air | 6,984 | $1,880,401 | $198,758 |
| 80 | Palms | 37,859 | $987,476 | $83,954 |
| 81 | Pacific Palisades | 21,864 | $2,000,001 | $205,646 |
| 82 | Brentwood | 31,709 | $1,392,827 | $163,253 |
| 83 | Mar Vista | 36,353 | $1,249,943 | $102,786 |


