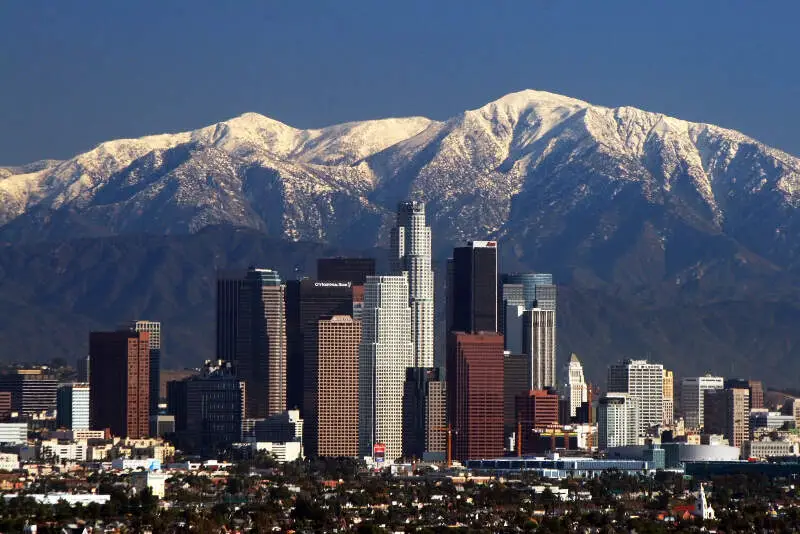
Los Angeles, CA
Demographics And Statistics
Living In Los Angeles, California Summary
Life in Los Angeles research summary. HomeSnacks has been using Saturday Night Science to research the quality of life in Los Angeles over the past nine years using Census, FBI, Zillow, and other primary data sources. Based on the most recently available data, we found the following about life in Los Angeles:
The population in Los Angeles is 3,857,897.
The median home value in Los Angeles is $936,303.
The median income in Los Angeles is $80,366.
The cost of living in Los Angeles is 171 which is 1.7x higher than the national average.
The median rent in Los Angeles is $1,879.
The unemployment rate in Los Angeles is 7.9%.
The poverty rate in Los Angeles is 16.5%.
The average high in Los Angeles is 75.3° and the average low is 54.1°.
Los Angeles SnackAbility
Overall SnackAbility
Los Angeles, CA Crime Report
Crime in Los Angeles summary. We use data from the FBI to determine the crime rates in Los Angeles. Key points include:
There were 83,991 total crimes in Los Angeles in the last reporting year.
The overall crime rate per 100,000 people in Los Angeles is 2,212.4 / 100k people.
The violent crime rate per 100,000 people in Los Angeles is 728.5 / 100k people.
The property crime rate per 100,000 people in Los Angeles is 1,483.9 / 100k people.
Overall, crime in Los Angeles is 4.40% above the national average.
Total Crimes
Above National Average
Crime In Los Angeles Comparison Table
| Statistic | Count Raw |
Los Angeles / 100k People |
California / 100k People |
National / 100k People |
|---|---|---|---|---|
| Total Crimes Per 100K | 83,991 | 2,212.4 | 2,564.5 | 2,119.2 |
| Violent Crime | 27,656 | 728.5 | 486.0 | 359.0 |
| Murder | 264 | 7.0 | 4.5 | 5.0 |
| Robbery | 7,967 | 209.9 | 119.1 | 61.0 |
| Aggravated Assault | 17,895 | 471.4 | 325.8 | 256.0 |
| Property Crime | 56,335 | 1,483.9 | 2,078.4 | 1,760.0 |
| Burglary | 14,152 | 372.8 | 305.8 | 229.0 |
| Larceny | 32,326 | 851.5 | 1,345.2 | 1,272.0 |
| Car Theft | 9,857 | 259.6 | 427.5 | 259.0 |
Los Angeles, CA Cost Of Living
Cost of living in Los Angeles summary. We use data on the cost of living to determine how expensive it is to live in Los Angeles. Real estate prices drive most of the variance in cost of living around California. Key points include:
The cost of living in Los Angeles is 171 with 100 being average.
The cost of living in Los Angeles is 1.7x higher than the national average.
The median home value in Los Angeles is $936,303.
The median income in Los Angeles is $80,366.
Los Angeles's Overall Cost Of Living
Higher Than The National Average
Cost Of Living In Los Angeles Comparison Table
| Living Expense | Los Angeles | California | National Average | |
|---|---|---|---|---|
| Overall | 171 | 141 | 100 | |
| Services | 117 | 110 | 100 | |
| Groceries | 112 | 112 | 100 | |
| Health | 109 | 110 | 100 | |
| Housing | 300 | 195 | 100 | |
| Transportation | 124 | 125 | 100 | |
| Utilities | 110 | 128 | 100 | |
Los Angeles, CA Weather
The average high in Los Angeles is 75.3° and the average low is 54.1°.
There are 22.7 days of precipitation each year.
Expect an average of 16.2 inches of precipitation each year with 0.2 inches of snow.
| Stat | Los Angeles |
|---|---|
| Average Annual High | 75.3 |
| Average Annual Low | 54.1 |
| Annual Precipitation Days | 22.7 |
| Average Annual Precipitation | 16.2 |
| Average Annual Snowfall | 0.2 |
Average High
Days of Rain
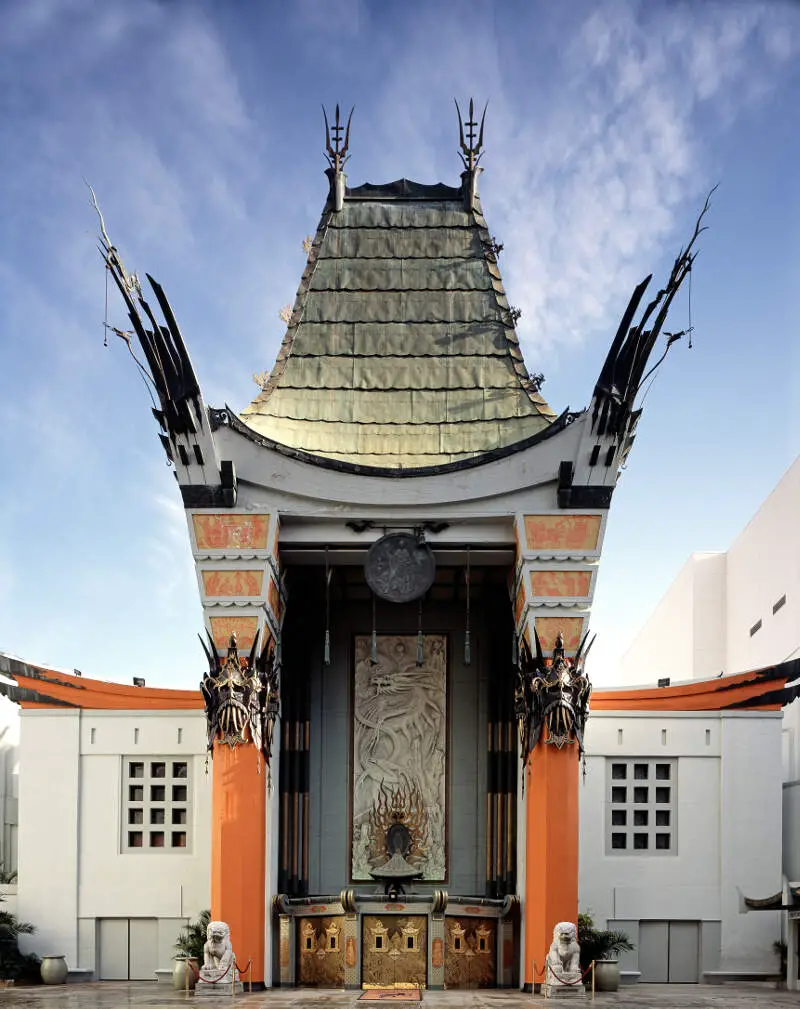
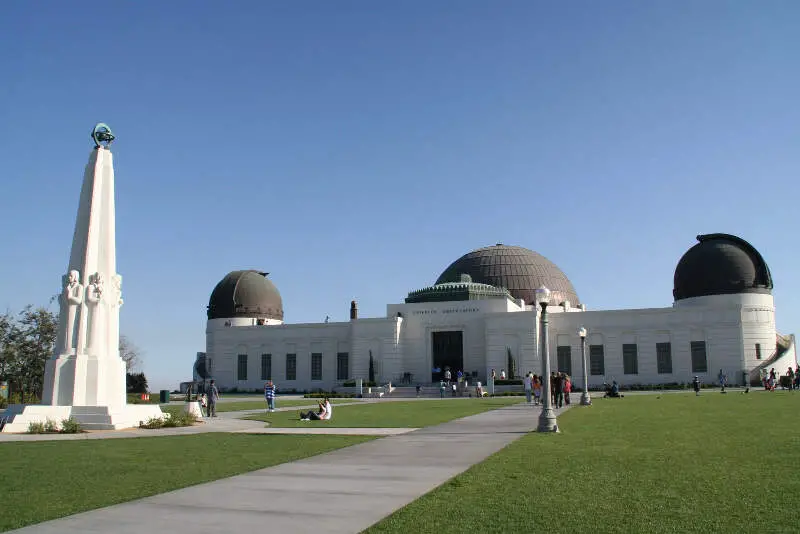
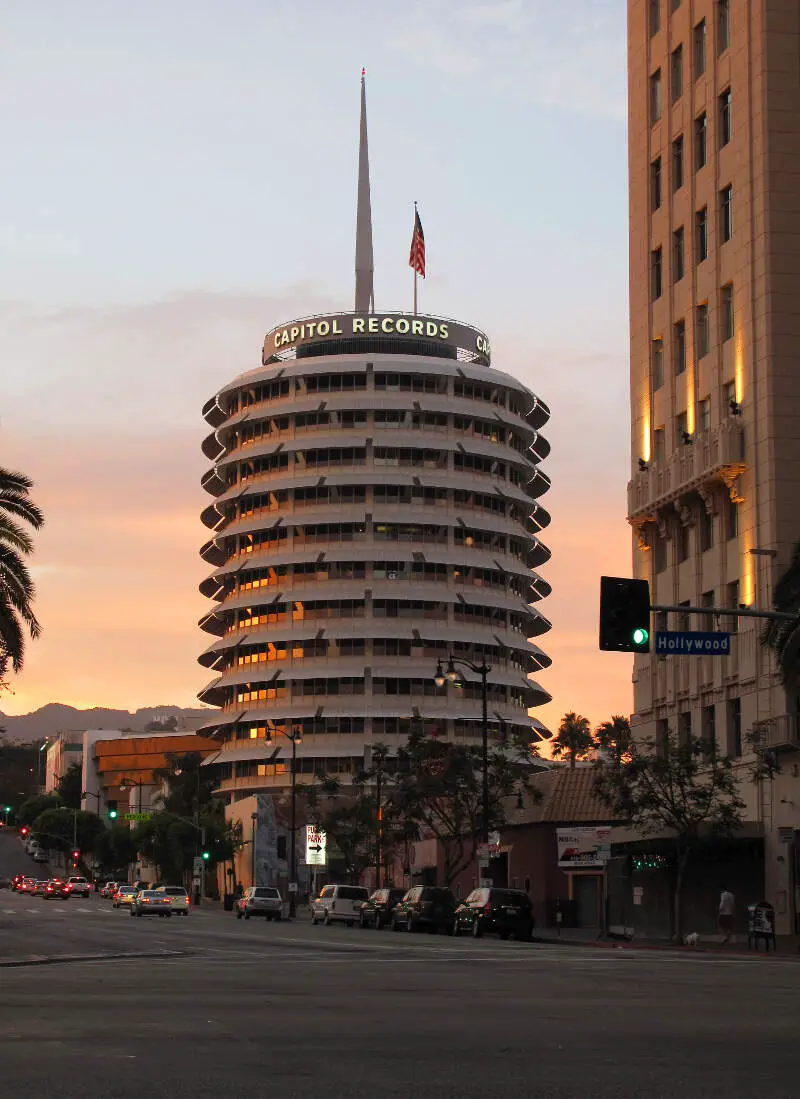
Los Angeles, CA Photos


17 Reviews & Comments About Los Angeles
/5

Eric Thatcher - None
I live in Los Angeles. The LA times says CA is #1 in poverty. #1 in wage disparity. We have the highest taxes, a housing shortage { Tiny one bedroom apartment in Silverlake $2995.00 a month } High crime, overcrowded schools. Los Angeles has 31, 513 homeless people nightly. We have the forth worst commute in America at 28.9 minutes taken by 84.2% of the population. CA has 7 of the top 10 cities with the worst air quality. People p**p all over the sidewalks in Los Angeles, San Diego and San Francisco.
# California! Worst state to live in. Trust me.
HomeSnacks User - 2018-07-15 02:04:51.352015
A horrible place filled with the most insipid cosmopolitans. soulless drones with only a respect for the mask of others.
the people are awful, destructive bugmen without a conscience. complete hedonic squalor.
HomeSnacks User - 2018-07-15 16:38:40.299267
There is some crime going on, but it really depends where in LA you're staying at. What I love is that everything is in close proximity so you don't need to go very far. Also, they have so many amazing restaurants to check out and love. There are so many different cultures, and that's what I really like about it.
There is a lot of graffiti and homeless people living in LA, so it makes you not want to go to certain locations. It is also very very overpopulated, and because of this, there is always too much traffic. What should only take 30 minutes to get to, takes over an hour.
HomeSnacks User - 2018-07-15 18:44:00.323260
The city is terribly dirty and there are homeless people everywhere.
The bugs. At night, it's best to not watch the ground. If you do you will be greeted by hundreds of large insects.
HomeSnacks User - 2018-07-15 19:25:06.523861
Los Angeles is a great place and it's so beautiful. It's always sunny and there's always something to do. Crime all depends on the area you leave in. I would say be careful period being that this is a huge city.
The bad is that there's so many people here. There's always traffic. The worst is the 405 freeway. The streets are no better.
HomeSnacks User - 2018-07-20 14:21:33.222195
school life is one of the best moment in my life that teaches me a lot to learn what life is
my all time favorite place is my room only that i like to spen time alone
HomeSnacks User - 2018-07-20 17:29:14.759583
The city is awful. The government lets the homeless just sleep where ever so there are tons of homeless encampments scattered around the town. The streets smell like pee and there are crazy people everywhere. The schools are trash unless you go to a private school. Crime is awful there is gangs and drug dealing everywhere.
The complete disregard for keeping the city safe and clean.
HomeSnacks User - 2018-07-20 18:23:07.066578
I had a great fun experience by spending time at the beach, hollywood, and at downtown. the food was awesome and weather was gorgeous as well. The people I met there were really friendly and cool also.
The traffic really stood out as we were spending hours on just commuting daily.
HomeSnacks User - 2018-07-23 12:24:28
There will be the theft crimes.But the cops will catch the thief within that day.Very good environment.Neat city and pollution will be less than other cities.Education wise also,California is best.
Redwood National Park
. SeaWorld San Diego
General Sherman
Venice Beach
Dante's View - Death Valley
Disneyland
Big Sur Coastline
this are the best place to visit in california
HomeSnacks User - 2018-08-03 02:05:50.757477
I hated being LA. The people in the city are awful, it's hot, it stinks. I can go on and on. There's nice places with jerky people. There's scummy places with even worse people. Trash in the streets everywhere. Everything is expensive.
Watch out for people trying to hustle you for money and people trying to sell you drugs.
HomeSnacks User - 2018-08-04 23:34:35.003878
Is very diverse. A lot of things to do and places to go. I love LA.
Bad things are extreme traffic and too many people make things expensive.
HomeSnacks User - 2018-08-05 06:32:05.515766
The crime is probably a little more than any other city or state. The schools are excellent and there are plenty of things to do in LA such as Magic Mountain, Disneyland, Musuems, Knoxberry Farm, Sea World, etc.
My favorite places to go to was the amusement parks such as Disneyland, Six Flags, Sea World, etc.
HomeSnacks User - 2018-08-20 18:14:56.044814
Many parts of it are dirty and full of homeless people.
A bad thing is driving in the city of LA with the horrible street conditions.
HomeSnacks User - 2018-09-06 02:08:44.111932
I hate parts of downtown, Los Angeles. It is so dirty and full of homeless people.
The streets and sidewalks are filled with trash. Doesn't seem like our tax dollars are being used wisely.
HomeSnacks User - 2018-09-06 03:50:35.771199
Living in Los Angeles is a lot of fun, there is a lot of diversity and a lot of natural hiking trails. The food here is amazing and there is a lot of variety available.
One of my favorite places is the Hollywood sign, you can hike up there or just drive to see the sign. One of the bad things about Los Angeles is it's traffic and parking due to high population.
HomeSnacks User - 2018-09-19 03:07:41.760976
I've heard so many positive things about LA and I am in love with the idea of all these great people who actually learn/work there. It just inspires me to strive to be the best
The best part is that there is so much scenery and you can find so many great things.
HomeSnacks User - 2018-09-19 03:54:36.250899
Terrible, it was uncorforatable and even though people claim it is warm it was too cold for me.
The people were the worst, always on their computers doing tech stuff I couldn't stand it.
Los Angeles Articles


Rankings for Los Angeles in California

Locations Around Los Angeles
Map Of Los Angeles, CA
Best Places Around Los Angeles
Del Aire, CA
Population 11,115
San Fernando, CA
Population 23,716
La Crescenta-Montrose, CA
Population 19,940
Torrance, CA
Population 143,499
South Pasadena, CA
Population 26,297
West Whittier-Los Nietos, CA
Population 25,459
Redondo Beach, CA
Population 69,814
Altadena, CA
Population 41,921
Rancho Palos Verdes, CA
Population 41,259
Ladera Heights, CA
Population 7,249
Los Angeles Demographics And Statistics
Population over time in Los Angeles
The current population in Los Angeles is 3,857,897. The population has increased 2.3% from 2010.
| Year | Population | % Change |
|---|---|---|
| 2023 | 3,857,897 | -0.6% |
| 2022 | 3,881,041 | -0.5% |
| 2021 | 3,902,440 | -1.8% |
| 2020 | 3,973,278 | 0.2% |
| 2019 | 3,966,936 | 0.2% |
| 2018 | 3,959,657 | 0.3% |
| 2017 | 3,949,776 | 0.8% |
| 2016 | 3,918,872 | 0.5% |
| 2015 | 3,900,794 | 1.0% |
| 2014 | 3,862,210 | 0.9% |
| 2013 | 3,827,261 | 0.6% |
| 2012 | 3,804,503 | 0.6% |
| 2011 | 3,782,544 | 0.3% |
| 2010 | 3,772,486 | - |
Race / Ethnicity in Los Angeles
Los Angeles is:
28.3% White with 1,092,687 White residents.
8.2% African American with 316,317 African American residents.
0.2% American Indian with 6,005 American Indian residents.
11.8% Asian with 456,460 Asian residents.
0.1% Hawaiian with 4,536 Hawaiian residents.
0.6% Other with 24,178 Other residents.
3.5% Two Or More with 135,551 Two Or More residents.
47.2% Hispanic with 1,822,163 Hispanic residents.
| Race | Los Angeles | CA | USA |
|---|---|---|---|
| White | 28.3% | 34.6% | 58.2% |
| African American | 8.2% | 5.3% | 12.0% |
| American Indian | 0.2% | 0.3% | 0.5% |
| Asian | 11.8% | 15.1% | 5.7% |
| Hawaiian | 0.1% | 0.3% | 0.2% |
| Other | 0.6% | 0.5% | 0.5% |
| Two Or More | 3.5% | 4.1% | 3.9% |
| Hispanic | 47.2% | 39.8% | 19.0% |
Gender in Los Angeles
Los Angeles is 50.2% female with 1,936,161 female residents.
Los Angeles is 49.8% male with 1,921,735 male residents.
| Gender | Los Angeles | CA | USA |
|---|---|---|---|
| Female | 50.2% | 50.0% | 50.5% |
| Male | 49.8% | 50.0% | 49.5% |
Highest level of educational attainment in Los Angeles for adults over 25
11.0% of adults in Los Angeles completed < 9th grade.
8.0% of adults in Los Angeles completed 9-12th grade.
19.0% of adults in Los Angeles completed high school / ged.
17.0% of adults in Los Angeles completed some college.
6.0% of adults in Los Angeles completed associate's degree.
25.0% of adults in Los Angeles completed bachelor's degree.
9.0% of adults in Los Angeles completed master's degree.
3.0% of adults in Los Angeles completed professional degree.
2.0% of adults in Los Angeles completed doctorate degree.
| Education | Los Angeles | CA | USA |
|---|---|---|---|
| < 9th Grade | 11.0% | 8.0% | 5.0% |
| 9-12th Grade | 8.0% | 7.0% | 6.0% |
| High School / GED | 19.0% | 20.0% | 26.0% |
| Some College | 17.0% | 20.0% | 19.0% |
| Associate's Degree | 6.0% | 8.0% | 9.0% |
| Bachelor's Degree | 25.0% | 22.0% | 21.0% |
| Master's Degree | 9.0% | 10.0% | 10.0% |
| Professional Degree | 3.0% | 3.0% | 2.0% |
| Doctorate Degree | 2.0% | 2.0% | 2.0% |
Household Income For Los Angeles, California
6.2% of households in Los Angeles earn Less than $10,000.
4.6% of households in Los Angeles earn $10,000 to $14,999.
6.7% of households in Los Angeles earn $15,000 to $24,999.
6.5% of households in Los Angeles earn $25,000 to $34,999.
9.4% of households in Los Angeles earn $35,000 to $49,999.
14.0% of households in Los Angeles earn $50,000 to $74,999.
11.5% of households in Los Angeles earn $75,000 to $99,999.
16.0% of households in Los Angeles earn $100,000 to $149,999.
9.2% of households in Los Angeles earn $150,000 to $199,999.
15.9% of households in Los Angeles earn $200,000 or more.
| Income | Los Angeles | CA | USA |
|---|---|---|---|
| Less than $10,000 | 6.2% | 4.4% | 4.9% |
| $10,000 to $14,999 | 4.6% | 3.0% | 3.6% |
| $15,000 to $24,999 | 6.7% | 5.2% | 6.6% |
| $25,000 to $34,999 | 6.5% | 5.5% | 6.8% |
| $35,000 to $49,999 | 9.4% | 8.4% | 10.4% |
| $50,000 to $74,999 | 14.0% | 13.3% | 15.7% |
| $75,000 to $99,999 | 11.5% | 11.8% | 12.7% |
| $100,000 to $149,999 | 16.0% | 17.9% | 17.4% |
| $150,000 to $199,999 | 9.2% | 11.1% | 9.3% |
| $200,000 or more | 15.9% | 19.4% | 12.6% |


