Huntsville SnackAbility
Overall SnackAbility
Cost of living in Huntsville summary. We use data on the cost of living to determine how expensive it is to live in Huntsville. Real estate prices drive most of the variance in cost of living around Alabama. Key points include:
The cost of living in Huntsville is 96 with 100 being average.
The cost of living in Huntsville is 1.0x lower than the national average.
The median home value in Huntsville is $287,569.
The median income in Huntsville is $74,714.
Huntsville's Overall Cost Of Living
Lower Than The National Average
Cost Of Living In Huntsville Comparison Table
| Living Expense | Huntsville | Alabama | National Average |
|---|---|---|---|
| Overall | 96 | 91 | 100 |
| Services | 94 | 95 | 100 |
| Groceries | 97 | 96 | 100 |
| Health | 98 | 74 | 100 |
| Housing | 98 | 96 | 100 |
| Transportation | 101 | 95 | 100 |
| Utilities | 89 | 95 | 100 |
Source: Cost of living index, normalized to US average = 100
Huntsville, AL Weather
The average high in Huntsville is 71.1° and the average low is 48.5°.
There are 78.9 days of precipitation each year.
Expect an average of 55.6 inches of precipitation each year with 1.6 inches of snow.
| Stat | Huntsville |
|---|---|
| Average Annual High | 71.1 |
| Average Annual Low | 48.5 |
| Annual Precipitation Days | 78.9 |
| Average Annual Precipitation | 55.6 |
| Average Annual Snowfall | 1.6 |
Average High
Days of Rain
Source: NOAA climate normals (30-year)
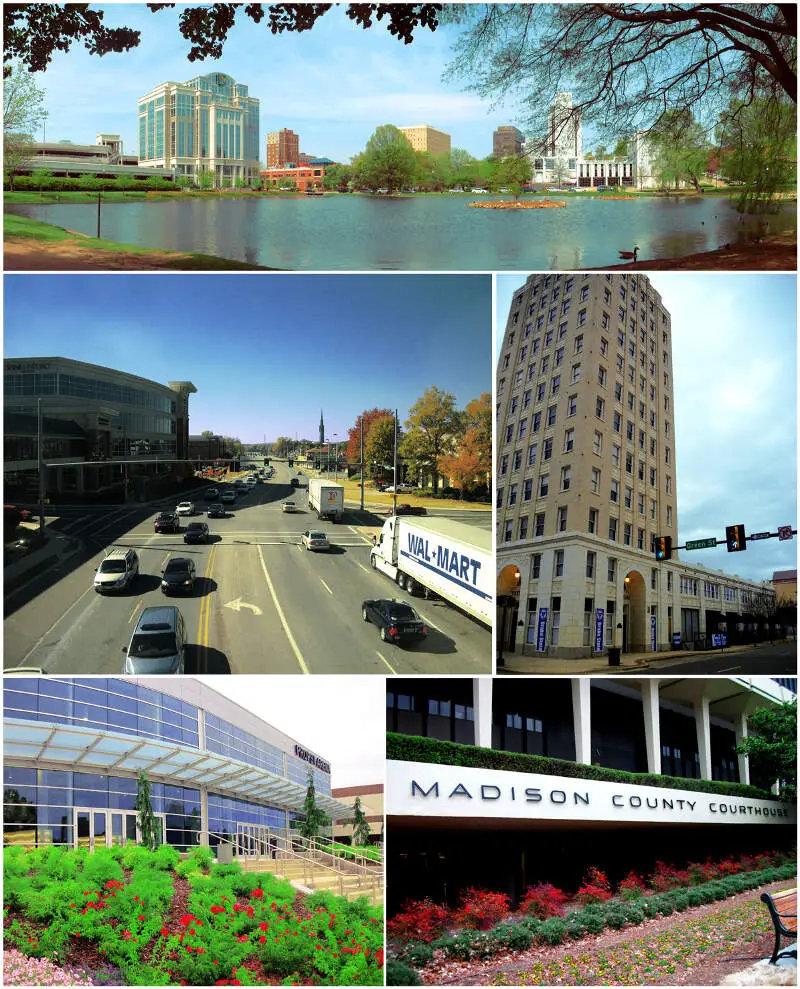
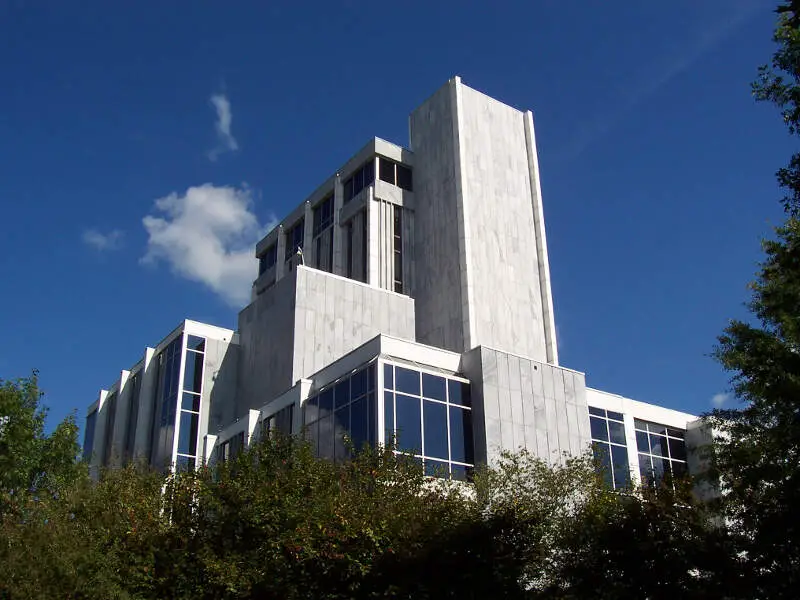
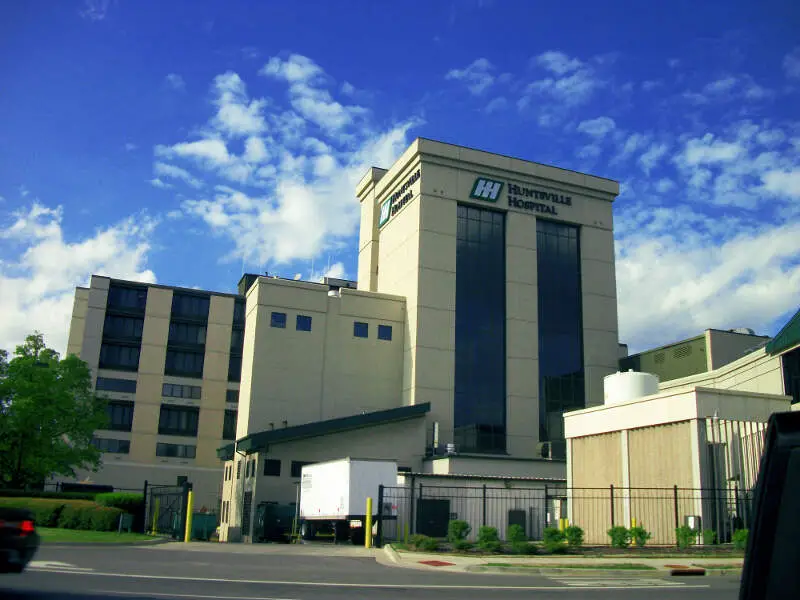
Huntsville, AL Photos


3 Reviews & Comments About Huntsville

I've been a lot of places... truth is, Alabama is awesome, just stay away from Birmingham. One common misconception: Alabama is NOT full of toothless rednecks. I live in Huntsville, the best place in the country for an engineer to live and work, and is the heart of aerospace and missile defense development. Alabama is also ground zero for the civil rights movement, so don't come down here with any racist c**p... black folks in Alabama will not tolerate that junk. In my experiences, VA, MD, and PA have way more racists than AL. Oh yeah, this guy who made this video clearly knows nothing about Alabama to be talking about her... the correct war cry is ROLL TIDE, not 'Go Crimson Tide'... dork.
The crime is low because a lot of people openly carry. The schools in a majority of the area are very well-kept and clean. The housing market is also phenomenal compared to places on the Eastern shore.
The Space Center had multiple things for parents, children, and the curious to explore regarding Space Exploration. The Huntsville Space station makes a lot of the rocket boosters and things like that. Redstone Arsenal is mostly army, so it gives a safer feeling.
I'm from Huntsville, Alabama and this article is true. I'm latino and was treated as a second class citizen by whites.
Rankings & Articles For Huntsville


Locations Around Huntsville
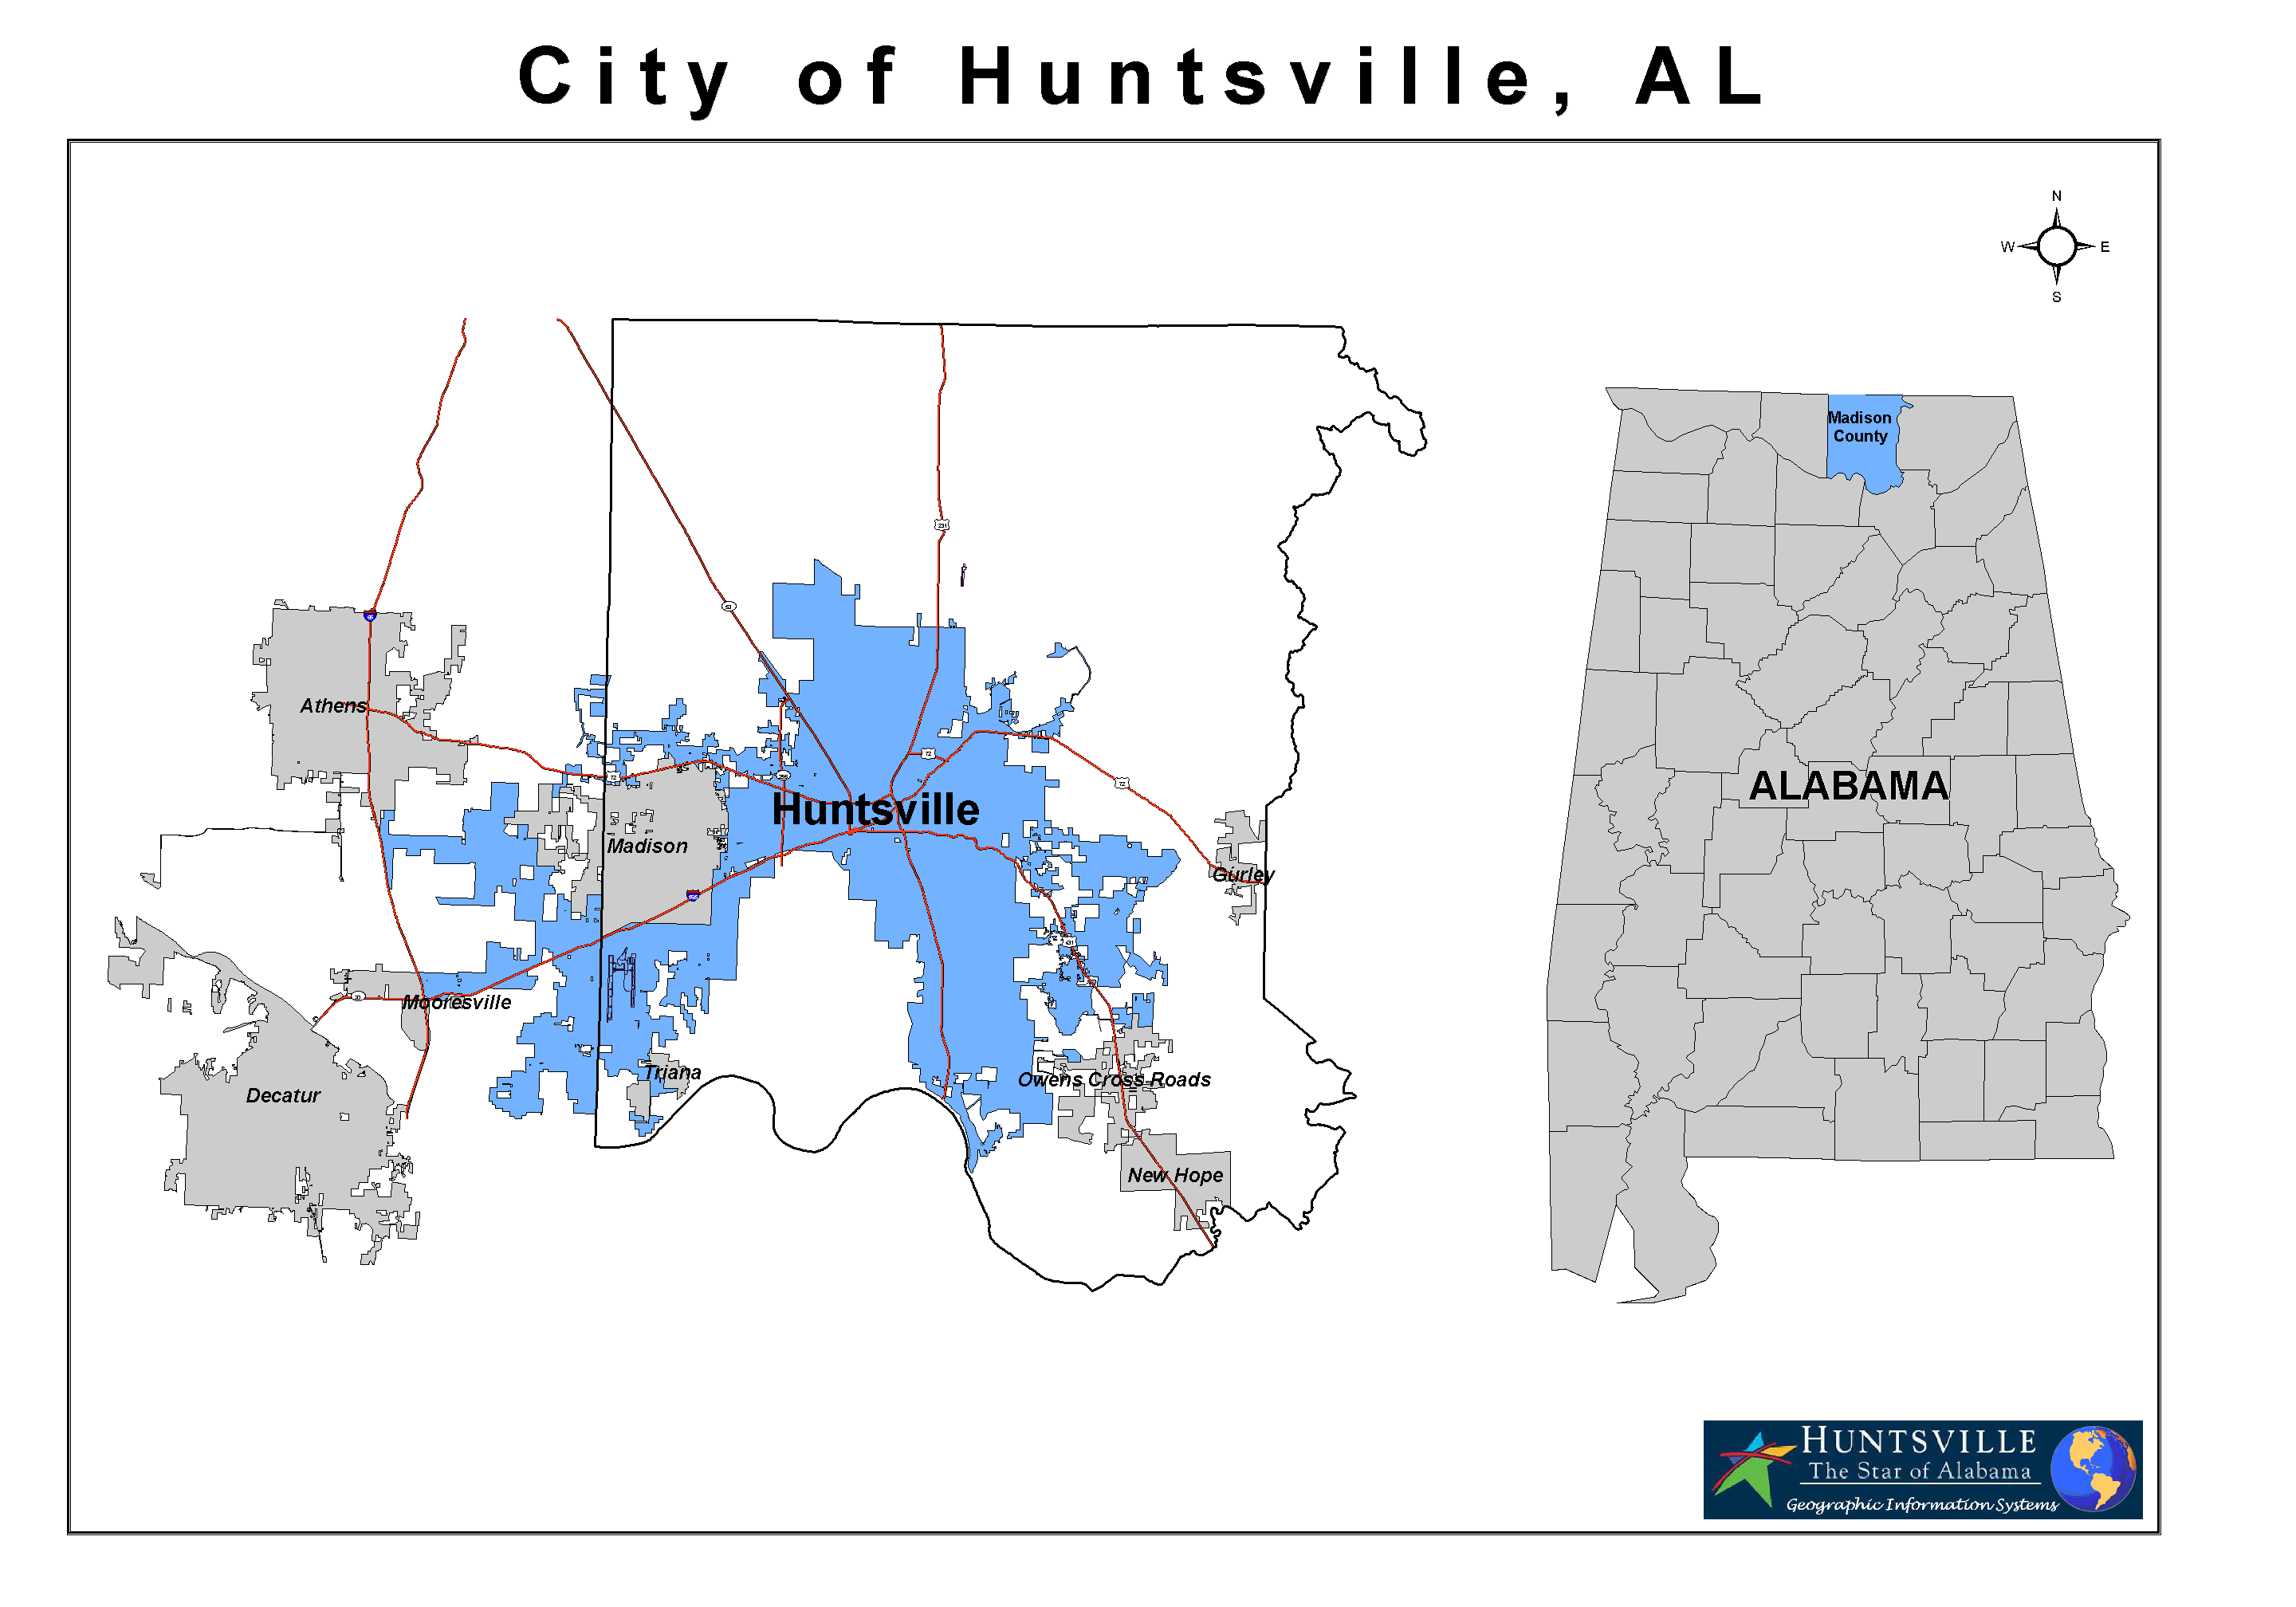
Map Of Huntsville, AL
Best Places Around Huntsville
Winchester, TN
Population 9,799
Fayetteville, TN
Population 7,057
Scottsboro, AL
Population 15,712
Cullman, AL
Population 19,319
Decatur, AL
Population 57,361
Athens, AL
Population 29,002
Albertville, AL
Population 22,813
Hartselle, AL
Population 15,847
Pulaski, TN
Population 8,285
Madison, AL
Population 60,106
Huntsville Demographics And Statistics
Population over time in Huntsville
The current population in Huntsville is 222,791. The population has increased 27.0% from 2010.
| Year | Population | % Change |
|---|---|---|
| 2024 | 222,791 | 1.8% |
| 2023 | 218,814 | 1.8% |
| 2022 | 215,025 | 2.4% |
| 2021 | 210,081 | 5.1% |
| 2020 | 199,845 | 1.8% |
| 2019 | 196,219 | 1.3% |
| 2018 | 193,663 | 1.7% |
| 2017 | 190,501 | 0.8% |
| 2016 | 188,973 | 1.8% |
| 2015 | 185,594 | 0.8% |
| 2014 | 184,132 | 1.0% |
| 2013 | 182,317 | 1.4% |
| 2012 | 179,855 | 1.1% |
| 2011 | 177,879 | 1.4% |
| 2010 | 175,416 | - |
Race / Ethnicity in Huntsville
See the full breakdown
Huntsville is:
55.9% White with 124,623 White residents.
28.8% African American with 64,092 African American residents.
0.3% American Indian with 568 American Indian residents.
2.1% Asian with 4,710 Asian residents.
0.1% Hawaiian with 154 Hawaiian residents.
0.3% Other with 656 Other residents.
4.6% Two Or More with 10,212 Two Or More residents.
8.0% Hispanic with 17,776 Hispanic residents.
| Race | Huntsville | AL | USA |
|---|---|---|---|
| White | 55.9% | 63.4% | 57.4% |
| African American | 28.8% | 25.6% | 11.9% |
| American Indian | 0.3% | 0.3% | 0.5% |
| Asian | 2.1% | 1.4% | 5.9% |
| Hawaiian | 0.1% | 0.0% | 0.2% |
| Other | 0.3% | 0.4% | 0.6% |
| Two Or More | 4.6% | 3.3% | 4.3% |
| Hispanic | 8.0% | 5.6% | 19.3% |
Gender in Huntsville
See the full breakdown
Huntsville is 51.1% female with 113,806 female residents.
Huntsville is 48.9% male with 108,984 male residents.
| Gender | Huntsville | AL | USA |
|---|---|---|---|
| Female | 51.1% | 51.4% | 50.5% |
| Male | 48.9% | 48.6% | 49.5% |
Highest level of educational attainment in Huntsville for adults over 25
See the full breakdown
3.0% of adults in Huntsville completed < 9th grade.
6.0% of adults in Huntsville completed 9-12th grade.
18.0% of adults in Huntsville completed high school / ged.
20.0% of adults in Huntsville completed some college.
7.0% of adults in Huntsville completed associate's degree.
27.0% of adults in Huntsville completed bachelor's degree.
15.0% of adults in Huntsville completed master's degree.
2.0% of adults in Huntsville completed professional degree.
2.0% of adults in Huntsville completed doctorate degree.
| Education | Huntsville | AL | USA |
|---|---|---|---|
| < 9th Grade | 3.0% | 4.0% | 4.0% |
| 9-12th Grade | 6.0% | 8.0% | 6.0% |
| High School / GED | 18.0% | 30.0% | 26.0% |
| Some College | 20.0% | 21.0% | 19.0% |
| Associate's Degree | 7.0% | 9.0% | 9.0% |
| Bachelor's Degree | 27.0% | 17.0% | 22.0% |
| Master's Degree | 15.0% | 8.0% | 10.0% |
| Professional Degree | 2.0% | 2.0% | 2.0% |
| Doctorate Degree | 2.0% | 1.0% | 2.0% |
Household Income For Huntsville, Alabama
See the full breakdown
5.5% of households in Huntsville earn Less than $10,000.
3.2% of households in Huntsville earn $10,000 to $14,999.
6.5% of households in Huntsville earn $15,000 to $24,999.
7.8% of households in Huntsville earn $25,000 to $34,999.
11.6% of households in Huntsville earn $35,000 to $49,999.
15.6% of households in Huntsville earn $50,000 to $74,999.
13.0% of households in Huntsville earn $75,000 to $99,999.
16.3% of households in Huntsville earn $100,000 to $149,999.
8.6% of households in Huntsville earn $150,000 to $199,999.
11.9% of households in Huntsville earn $200,000 or more.
| Income | Huntsville | AL | USA |
|---|---|---|---|
| Less than $10,000 | 5.5% | 6.3% | 5.0% |
| $10,000 to $14,999 | 3.2% | 4.7% | 3.4% |
| $15,000 to $24,999 | 6.5% | 8.8% | 6.3% |
| $25,000 to $34,999 | 7.8% | 8.5% | 6.6% |
| $35,000 to $49,999 | 11.6% | 11.8% | 10.1% |
| $50,000 to $74,999 | 15.6% | 16.7% | 15.5% |
| $75,000 to $99,999 | 13.0% | 12.7% | 12.6% |
| $100,000 to $149,999 | 16.3% | 15.5% | 17.5% |
| $150,000 to $199,999 | 8.6% | 7.4% | 9.6% |
| $200,000 or more | 11.9% | 7.8% | 13.4% |
Source: U.S. Census ACS 5-year estimates (2024)


