Albertville SnackAbility
Overall SnackAbility
Cost of living in Albertville summary. We use data on the cost of living to determine how expensive it is to live in Albertville. Real estate prices drive most of the variance in cost of living around Alabama. Key points include:
The cost of living in Albertville is 88 with 100 being average.
The cost of living in Albertville is 0.9x lower than the national average.
The median home value in Albertville is $214,034.
The median income in Albertville is $56,099.
Albertville's Overall Cost Of Living
Lower Than The National Average
Cost Of Living In Albertville Comparison Table
| Living Expense | Albertville | Alabama | National Average |
|---|---|---|---|
| Overall | 88 | 91 | 100 |
| Services | 94 | 95 | 100 |
| Groceries | 93 | 96 | 100 |
| Health | 71 | 74 | 100 |
| Housing | 90 | 96 | 100 |
| Transportation | 99 | 95 | 100 |
| Utilities | 95 | 95 | 100 |
Source: Cost of living index, normalized to US average = 100
Albertville, AL Weather
The average high in Albertville is 70.8° and the average low is 49.7°.
There are 79.6 days of precipitation each year.
Expect an average of 54.7 inches of precipitation each year with 0.7 inches of snow.
| Stat | Albertville |
|---|---|
| Average Annual High | 70.8 |
| Average Annual Low | 49.7 |
| Annual Precipitation Days | 79.6 |
| Average Annual Precipitation | 54.7 |
| Average Annual Snowfall | 0.7 |
Average High
Days of Rain
Source: NOAA climate normals (30-year)
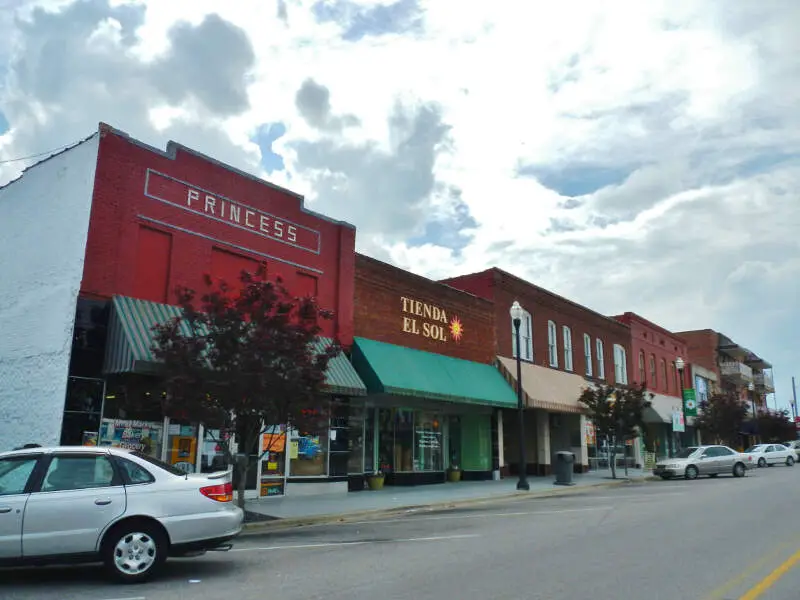
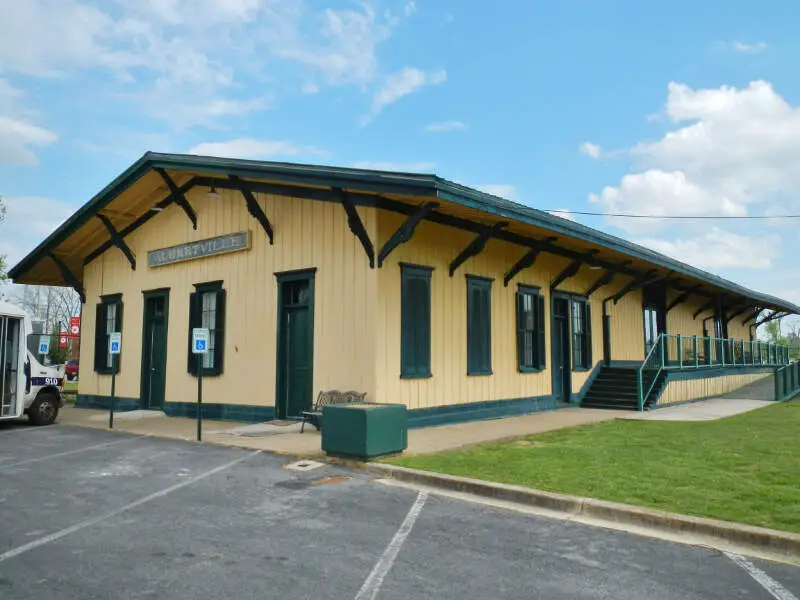
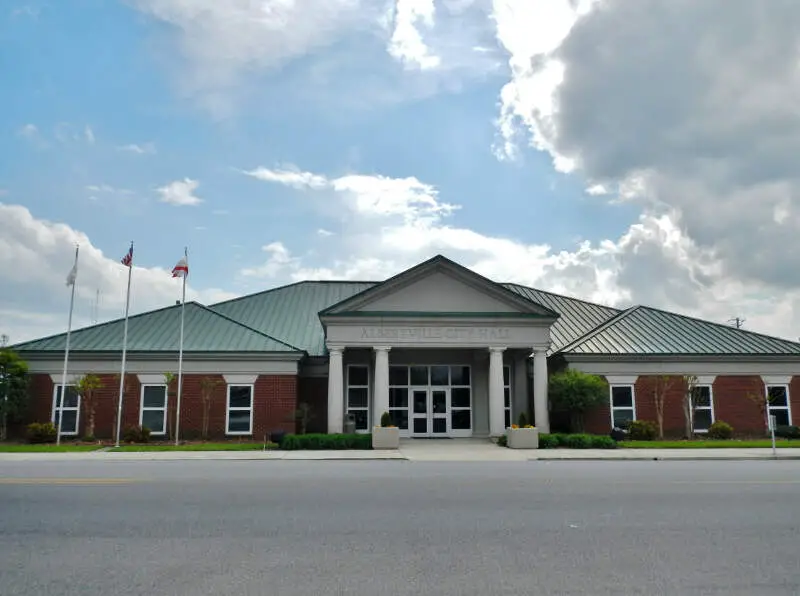
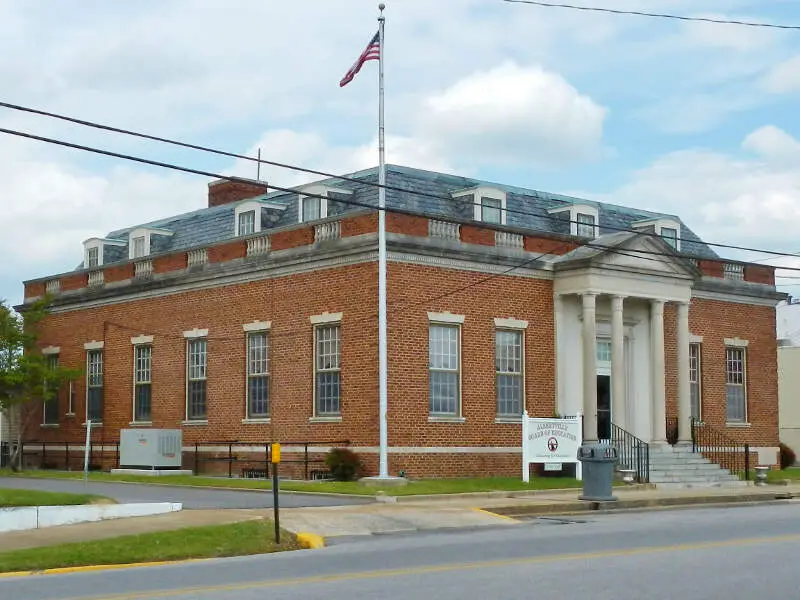
Albertville, AL Photos


Rankings & Articles For Albertville


Locations Around Albertville
Map Of Albertville, AL
Best Places Around Albertville
Gadsden, AL
Population 33,374
Anniston, AL
Population 21,271
Fort Payne, AL
Population 14,927
Jacksonville, AL
Population 14,437
Scottsboro, AL
Population 15,712
Cullman, AL
Population 19,319
Saks, AL
Population 10,681
Huntsville, AL
Population 222,791
Decatur, AL
Population 57,361
Moody, AL
Population 13,488
Albertville Demographics And Statistics
Population over time in Albertville
The current population in Albertville is 22,813. The population has increased 11.6% from 2010.
| Year | Population | % Change |
|---|---|---|
| 2024 | 22,813 | 1.0% |
| 2023 | 22,584 | 0.7% |
| 2022 | 22,433 | 0.7% |
| 2021 | 22,268 | 3.0% |
| 2020 | 21,620 | 0.4% |
| 2019 | 21,541 | 0.4% |
| 2018 | 21,460 | 0.6% |
| 2017 | 21,342 | -0.4% |
| 2016 | 21,434 | 0.1% |
| 2015 | 21,406 | 0.2% |
| 2014 | 21,363 | 0.4% |
| 2013 | 21,281 | 1.0% |
| 2012 | 21,079 | 1.3% |
| 2011 | 20,804 | 1.8% |
| 2010 | 20,445 | - |
Race / Ethnicity in Albertville
See the full breakdown
Albertville is:
62.4% White with 14,235 White residents.
4.6% African American with 1,060 African American residents.
0.0% American Indian with 0 American Indian residents.
0.5% Asian with 121 Asian residents.
0.3% Hawaiian with 68 Hawaiian residents.
0.0% Other with 9 Other residents.
1.3% Two Or More with 291 Two Or More residents.
30.8% Hispanic with 7,029 Hispanic residents.
| Race | Albertville | AL | USA |
|---|---|---|---|
| White | 62.4% | 63.4% | 57.4% |
| African American | 4.6% | 25.6% | 11.9% |
| American Indian | 0.0% | 0.3% | 0.5% |
| Asian | 0.5% | 1.4% | 5.9% |
| Hawaiian | 0.3% | 0.0% | 0.2% |
| Other | 0.0% | 0.4% | 0.6% |
| Two Or More | 1.3% | 3.3% | 4.3% |
| Hispanic | 30.8% | 5.6% | 19.3% |
Gender in Albertville
See the full breakdown
Albertville is 52.1% female with 11,891 female residents.
Albertville is 47.9% male with 10,922 male residents.
| Gender | Albertville | AL | USA |
|---|---|---|---|
| Female | 52.1% | 51.4% | 50.5% |
| Male | 47.9% | 48.6% | 49.5% |
Highest level of educational attainment in Albertville for adults over 25
See the full breakdown
10.0% of adults in Albertville completed < 9th grade.
7.0% of adults in Albertville completed 9-12th grade.
28.0% of adults in Albertville completed high school / ged.
21.0% of adults in Albertville completed some college.
13.0% of adults in Albertville completed associate's degree.
15.0% of adults in Albertville completed bachelor's degree.
4.0% of adults in Albertville completed master's degree.
1.0% of adults in Albertville completed professional degree.
1.0% of adults in Albertville completed doctorate degree.
| Education | Albertville | AL | USA |
|---|---|---|---|
| < 9th Grade | 10.0% | 4.0% | 4.0% |
| 9-12th Grade | 7.0% | 8.0% | 6.0% |
| High School / GED | 28.0% | 30.0% | 26.0% |
| Some College | 21.0% | 21.0% | 19.0% |
| Associate's Degree | 13.0% | 9.0% | 9.0% |
| Bachelor's Degree | 15.0% | 17.0% | 22.0% |
| Master's Degree | 4.0% | 8.0% | 10.0% |
| Professional Degree | 1.0% | 2.0% | 2.0% |
| Doctorate Degree | 1.0% | 1.0% | 2.0% |
Household Income For Albertville, Alabama
See the full breakdown
6.2% of households in Albertville earn Less than $10,000.
6.0% of households in Albertville earn $10,000 to $14,999.
11.1% of households in Albertville earn $15,000 to $24,999.
9.4% of households in Albertville earn $25,000 to $34,999.
12.6% of households in Albertville earn $35,000 to $49,999.
13.7% of households in Albertville earn $50,000 to $74,999.
14.9% of households in Albertville earn $75,000 to $99,999.
14.9% of households in Albertville earn $100,000 to $149,999.
6.5% of households in Albertville earn $150,000 to $199,999.
4.5% of households in Albertville earn $200,000 or more.
| Income | Albertville | AL | USA |
|---|---|---|---|
| Less than $10,000 | 6.2% | 6.3% | 5.0% |
| $10,000 to $14,999 | 6.0% | 4.7% | 3.4% |
| $15,000 to $24,999 | 11.1% | 8.8% | 6.3% |
| $25,000 to $34,999 | 9.4% | 8.5% | 6.6% |
| $35,000 to $49,999 | 12.6% | 11.8% | 10.1% |
| $50,000 to $74,999 | 13.7% | 16.7% | 15.5% |
| $75,000 to $99,999 | 14.9% | 12.7% | 12.6% |
| $100,000 to $149,999 | 14.9% | 15.5% | 17.5% |
| $150,000 to $199,999 | 6.5% | 7.4% | 9.6% |
| $200,000 or more | 4.5% | 7.8% | 13.4% |
Source: U.S. Census ACS 5-year estimates (2024)


