Cullman SnackAbility
Overall SnackAbility
Crime in Cullman summary. We use data from the FBI to determine the crime rates in Cullman. Key points include:
There were 548 total crimes in Cullman in the last reporting year.
The overall crime rate per 100,000 people in Cullman is 2,681.9 / 100k people.
The violent crime rate per 100,000 people in Cullman is 215.3 / 100k people.
The property crime rate per 100,000 people in Cullman is 2,466.6 / 100k people.
Overall, crime in Cullman is 26.55% above the national average.
Total Crimes
Above National Average
Crime In Cullman Comparison Table
| Statistic | Count Raw |
Cullman / 100k People |
Alabama / 100k People |
National / 100k People |
|---|---|---|---|---|
| Total Crimes Per 100K | 548 | 2,681.9 | 1,924.9 | 2,119.2 |
| Violent Crime | 44 | 215.3 | 359.9 | 359.0 |
| Murder | 3 | 14.7 | 8.7 | 5.0 |
| Robbery | 2 | 9.8 | 34.0 | 61.0 |
| Aggravated Assault | 33 | 161.5 | 291.4 | 256.0 |
| Property Crime | 504 | 2,466.6 | 1,565.1 | 1,760.0 |
| Burglary | 36 | 176.2 | 243.5 | 229.0 |
| Larceny | 436 | 2,133.8 | 1,148.5 | 1,272.0 |
| Car Theft | 32 | 156.6 | 173.0 | 259.0 |
Source: FBI Uniform Crime Reporting (2024)
Cost of living in Cullman summary. We use data on the cost of living to determine how expensive it is to live in Cullman. Real estate prices drive most of the variance in cost of living around Alabama. Key points include:
The cost of living in Cullman is 90 with 100 being average.
The cost of living in Cullman is 0.9x lower than the national average.
The median home value in Cullman is $261,636.
The median income in Cullman is $61,224.
Cullman's Overall Cost Of Living
Lower Than The National Average
Cost Of Living In Cullman Comparison Table
| Living Expense | Cullman | Alabama | National Average |
|---|---|---|---|
| Overall | 90 | 91 | 100 |
| Services | 96 | 95 | 100 |
| Groceries | 100 | 96 | 100 |
| Health | 82 | 74 | 100 |
| Housing | 95 | 96 | 100 |
| Transportation | 100 | 95 | 100 |
| Utilities | 93 | 95 | 100 |
Source: Cost of living index, normalized to US average = 100
Cullman, AL Weather
The average high in Cullman is 71.4° and the average low is 49.0°.
There are 78.9 days of precipitation each year.
Expect an average of 57.9 inches of precipitation each year with 0.8 inches of snow.
| Stat | Cullman |
|---|---|
| Average Annual High | 71.4 |
| Average Annual Low | 49.0 |
| Annual Precipitation Days | 78.9 |
| Average Annual Precipitation | 57.9 |
| Average Annual Snowfall | 0.8 |
Average High
Days of Rain
Source: NOAA climate normals (30-year)
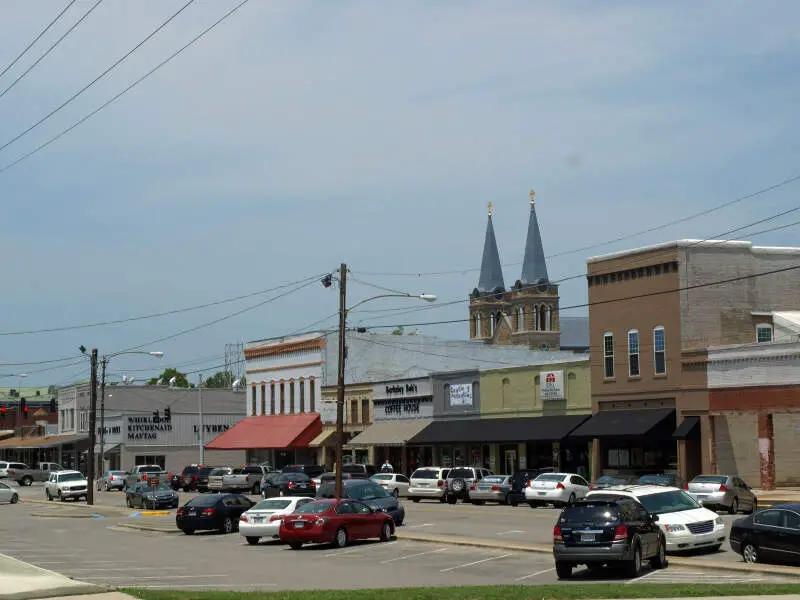
Cullman, AL Photos

Rankings & Articles For Cullman


Locations Around Cullman
Map Of Cullman, AL
Best Places Around Cullman
Gadsden, AL
Population 33,374
Birmingham, AL
Population 198,173
Jasper, AL
Population 14,442
Fairfield, AL
Population 9,728
Huntsville, AL
Population 222,791
Irondale, AL
Population 13,464
Decatur, AL
Population 57,361
Athens, AL
Population 29,002
Moody, AL
Population 13,488
Leeds, AL
Population 12,028
Cullman Demographics And Statistics
Population over time in Cullman
The current population in Cullman is 19,319. The population has increased 31.6% from 2010.
| Year | Population | % Change |
|---|---|---|
| 2024 | 19,319 | 2.2% |
| 2023 | 18,894 | 2.5% |
| 2022 | 18,434 | 3.0% |
| 2021 | 17,892 | 11.3% |
| 2020 | 16,072 | 2.2% |
| 2019 | 15,729 | 1.1% |
| 2018 | 15,558 | 3.0% |
| 2017 | 15,111 | -0.3% |
| 2016 | 15,156 | 0.9% |
| 2015 | 15,014 | 0.5% |
| 2014 | 14,933 | 0.5% |
| 2013 | 14,863 | 0.4% |
| 2012 | 14,801 | 0.4% |
| 2011 | 14,744 | 0.4% |
| 2010 | 14,685 | - |
Race / Ethnicity in Cullman
See the full breakdown
Cullman is:
88.7% White with 17,129 White residents.
0.6% African American with 114 African American residents.
0.0% American Indian with 1 American Indian residents.
0.3% Asian with 57 Asian residents.
0.0% Hawaiian with 0 Hawaiian residents.
0.0% Other with 0 Other residents.
7.1% Two Or More with 1,372 Two Or More residents.
3.3% Hispanic with 646 Hispanic residents.
| Race | Cullman | AL | USA |
|---|---|---|---|
| White | 88.7% | 63.4% | 57.4% |
| African American | 0.6% | 25.6% | 11.9% |
| American Indian | 0.0% | 0.3% | 0.5% |
| Asian | 0.3% | 1.4% | 5.9% |
| Hawaiian | 0.0% | 0.0% | 0.2% |
| Other | 0.0% | 0.4% | 0.6% |
| Two Or More | 7.1% | 3.3% | 4.3% |
| Hispanic | 3.3% | 5.6% | 19.3% |
Gender in Cullman
See the full breakdown
Cullman is 52.2% female with 10,092 female residents.
Cullman is 47.8% male with 9,227 male residents.
| Gender | Cullman | AL | USA |
|---|---|---|---|
| Female | 52.2% | 51.4% | 50.5% |
| Male | 47.8% | 48.6% | 49.5% |
Highest level of educational attainment in Cullman for adults over 25
See the full breakdown
3.0% of adults in Cullman completed < 9th grade.
6.0% of adults in Cullman completed 9-12th grade.
28.0% of adults in Cullman completed high school / ged.
17.0% of adults in Cullman completed some college.
13.0% of adults in Cullman completed associate's degree.
21.0% of adults in Cullman completed bachelor's degree.
9.0% of adults in Cullman completed master's degree.
2.0% of adults in Cullman completed professional degree.
1.0% of adults in Cullman completed doctorate degree.
| Education | Cullman | AL | USA |
|---|---|---|---|
| < 9th Grade | 3.0% | 4.0% | 4.0% |
| 9-12th Grade | 6.0% | 8.0% | 6.0% |
| High School / GED | 28.0% | 30.0% | 26.0% |
| Some College | 17.0% | 21.0% | 19.0% |
| Associate's Degree | 13.0% | 9.0% | 9.0% |
| Bachelor's Degree | 21.0% | 17.0% | 22.0% |
| Master's Degree | 9.0% | 8.0% | 10.0% |
| Professional Degree | 2.0% | 2.0% | 2.0% |
| Doctorate Degree | 1.0% | 1.0% | 2.0% |
Household Income For Cullman, Alabama
See the full breakdown
9.2% of households in Cullman earn Less than $10,000.
5.7% of households in Cullman earn $10,000 to $14,999.
8.4% of households in Cullman earn $15,000 to $24,999.
7.9% of households in Cullman earn $25,000 to $34,999.
12.7% of households in Cullman earn $35,000 to $49,999.
10.8% of households in Cullman earn $50,000 to $74,999.
14.8% of households in Cullman earn $75,000 to $99,999.
15.1% of households in Cullman earn $100,000 to $149,999.
8.1% of households in Cullman earn $150,000 to $199,999.
7.2% of households in Cullman earn $200,000 or more.
| Income | Cullman | AL | USA |
|---|---|---|---|
| Less than $10,000 | 9.2% | 6.3% | 5.0% |
| $10,000 to $14,999 | 5.7% | 4.7% | 3.4% |
| $15,000 to $24,999 | 8.4% | 8.8% | 6.3% |
| $25,000 to $34,999 | 7.9% | 8.5% | 6.6% |
| $35,000 to $49,999 | 12.7% | 11.8% | 10.1% |
| $50,000 to $74,999 | 10.8% | 16.7% | 15.5% |
| $75,000 to $99,999 | 14.8% | 12.7% | 12.6% |
| $100,000 to $149,999 | 15.1% | 15.5% | 17.5% |
| $150,000 to $199,999 | 8.1% | 7.4% | 9.6% |
| $200,000 or more | 7.2% | 7.8% | 13.4% |
Source: U.S. Census ACS 5-year estimates (2024)


