Roanoke SnackAbility
Overall SnackAbility
Cost of living in Roanoke summary. We use data on the cost of living to determine how expensive it is to live in Roanoke. Real estate prices drive most of the variance in cost of living around Alabama. Key points include:
The cost of living in Roanoke is 89 with 100 being average.
The cost of living in Roanoke is 0.9x lower than the national average.
The median home value in Roanoke is $148,369.
The median income in Roanoke is $47,105.
Roanoke's Overall Cost Of Living
Lower Than The National Average
Cost Of Living In Roanoke Comparison Table
| Living Expense | Roanoke | Alabama | National Average |
|---|---|---|---|
| Overall | 89 | 91 | 100 |
| Services | 99 | 95 | 100 |
| Groceries | 98 | 96 | 100 |
| Health | 62 | 74 | 100 |
| Housing | 98 | 96 | 100 |
| Transportation | 102 | 95 | 100 |
| Utilities | 97 | 95 | 100 |
Source: Cost of living index, normalized to US average = 100
Roanoke, AL Weather
The average high in Roanoke is 73.2° and the average low is 48.8°.
There are 75.5 days of precipitation each year.
Expect an average of 53.2 inches of precipitation each year with 0.9 inches of snow.
| Stat | Roanoke |
|---|---|
| Average Annual High | 73.2 |
| Average Annual Low | 48.8 |
| Annual Precipitation Days | 75.5 |
| Average Annual Precipitation | 53.2 |
| Average Annual Snowfall | 0.9 |
Average High
Days of Rain
Source: NOAA climate normals (30-year)
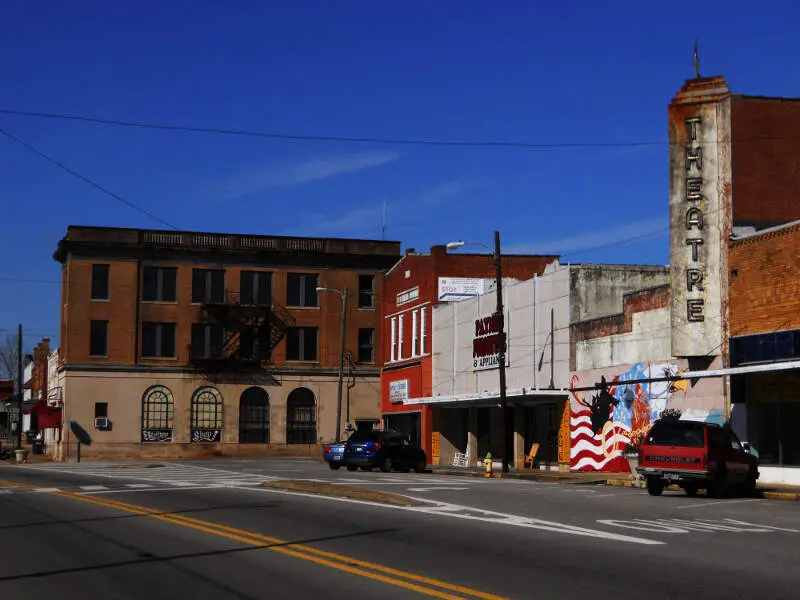
Roanoke, AL Photos
Rankings & Articles For Roanoke


Locations Around Roanoke
Map Of Roanoke, AL
Best Places Around Roanoke
Newnan, GA
Population 44,235
Villa Rica, GA
Population 18,551
Bremen, GA
Population 7,488
Anniston, AL
Population 21,271
Talladega, AL
Population 14,760
Opelika, AL
Population 32,820
Saks, AL
Population 10,681
LaGrange, GA
Population 32,078
Oxford, AL
Population 22,063
Carrollton, GA
Population 27,392
Roanoke Demographics And Statistics
Population over time in Roanoke
The current population in Roanoke is 5,336. The population has decreased 13.3% from 2010.
| Year | Population | % Change |
|---|---|---|
| 2024 | 5,336 | 0.1% |
| 2023 | 5,332 | -0.3% |
| 2022 | 5,346 | -0.4% |
| 2021 | 5,368 | -9.5% |
| 2020 | 5,931 | 0.1% |
| 2019 | 5,926 | -0.3% |
| 2018 | 5,941 | 0.3% |
| 2017 | 5,925 | -1.0% |
| 2016 | 5,987 | -0.4% |
| 2015 | 6,013 | 0.0% |
| 2014 | 6,013 | -1.1% |
| 2013 | 6,078 | 0.0% |
| 2012 | 6,075 | -0.7% |
| 2011 | 6,116 | -0.6% |
| 2010 | 6,154 | - |
Race / Ethnicity in Roanoke
See the full breakdown
Roanoke is:
57.4% White with 3,061 White residents.
39.9% African American with 2,131 African American residents.
0.0% American Indian with 0 American Indian residents.
0.1% Asian with 8 Asian residents.
0.0% Hawaiian with 0 Hawaiian residents.
0.0% Other with 0 Other residents.
1.0% Two Or More with 55 Two Or More residents.
1.5% Hispanic with 81 Hispanic residents.
| Race | Roanoke | AL | USA |
|---|---|---|---|
| White | 57.4% | 63.4% | 57.4% |
| African American | 39.9% | 25.6% | 11.9% |
| American Indian | 0.0% | 0.3% | 0.5% |
| Asian | 0.1% | 1.4% | 5.9% |
| Hawaiian | 0.0% | 0.0% | 0.2% |
| Other | 0.0% | 0.4% | 0.6% |
| Two Or More | 1.0% | 3.3% | 4.3% |
| Hispanic | 1.5% | 5.6% | 19.3% |
Gender in Roanoke
See the full breakdown
Roanoke is 51.8% female with 2,766 female residents.
Roanoke is 48.2% male with 2,570 male residents.
| Gender | Roanoke | AL | USA |
|---|---|---|---|
| Female | 51.8% | 51.4% | 50.5% |
| Male | 48.2% | 48.6% | 49.5% |
Highest level of educational attainment in Roanoke for adults over 25
See the full breakdown
4.0% of adults in Roanoke completed < 9th grade.
8.0% of adults in Roanoke completed 9-12th grade.
44.0% of adults in Roanoke completed high school / ged.
17.0% of adults in Roanoke completed some college.
10.0% of adults in Roanoke completed associate's degree.
11.0% of adults in Roanoke completed bachelor's degree.
5.0% of adults in Roanoke completed master's degree.
1.0% of adults in Roanoke completed professional degree.
0.0% of adults in Roanoke completed doctorate degree.
| Education | Roanoke | AL | USA |
|---|---|---|---|
| < 9th Grade | 4.0% | 4.0% | 4.0% |
| 9-12th Grade | 8.0% | 8.0% | 6.0% |
| High School / GED | 44.0% | 30.0% | 26.0% |
| Some College | 17.0% | 21.0% | 19.0% |
| Associate's Degree | 10.0% | 9.0% | 9.0% |
| Bachelor's Degree | 11.0% | 17.0% | 22.0% |
| Master's Degree | 5.0% | 8.0% | 10.0% |
| Professional Degree | 1.0% | 2.0% | 2.0% |
| Doctorate Degree | 0.0% | 1.0% | 2.0% |
Household Income For Roanoke, Alabama
See the full breakdown
7.2% of households in Roanoke earn Less than $10,000.
12.0% of households in Roanoke earn $10,000 to $14,999.
8.1% of households in Roanoke earn $15,000 to $24,999.
11.3% of households in Roanoke earn $25,000 to $34,999.
13.1% of households in Roanoke earn $35,000 to $49,999.
19.6% of households in Roanoke earn $50,000 to $74,999.
12.0% of households in Roanoke earn $75,000 to $99,999.
10.6% of households in Roanoke earn $100,000 to $149,999.
4.1% of households in Roanoke earn $150,000 to $199,999.
2.0% of households in Roanoke earn $200,000 or more.
| Income | Roanoke | AL | USA |
|---|---|---|---|
| Less than $10,000 | 7.2% | 6.3% | 5.0% |
| $10,000 to $14,999 | 12.0% | 4.7% | 3.4% |
| $15,000 to $24,999 | 8.1% | 8.8% | 6.3% |
| $25,000 to $34,999 | 11.3% | 8.5% | 6.6% |
| $35,000 to $49,999 | 13.1% | 11.8% | 10.1% |
| $50,000 to $74,999 | 19.6% | 16.7% | 15.5% |
| $75,000 to $99,999 | 12.0% | 12.7% | 12.6% |
| $100,000 to $149,999 | 10.6% | 15.5% | 17.5% |
| $150,000 to $199,999 | 4.1% | 7.4% | 9.6% |
| $200,000 or more | 2.0% | 7.8% | 13.4% |
Source: U.S. Census ACS 5-year estimates (2024)


