Anniston SnackAbility
Overall SnackAbility
Crime in Anniston summary. We use data from the FBI to determine the crime rates in Anniston. Key points include:
There were 1,097 total crimes in Anniston in the last reporting year.
The overall crime rate per 100,000 people in Anniston is 5,210.9 / 100k people.
The violent crime rate per 100,000 people in Anniston is 845.5 / 100k people.
The property crime rate per 100,000 people in Anniston is 4,365.4 / 100k people.
Overall, crime in Anniston is 145.89% above the national average.
Total Crimes
Above National Average
Crime In Anniston Comparison Table
| Statistic | Count Raw |
Anniston / 100k People |
Alabama / 100k People |
National / 100k People |
|---|---|---|---|---|
| Total Crimes Per 100K | 1,097 | 5,210.9 | 1,924.9 | 2,119.2 |
| Violent Crime | 178 | 845.5 | 359.9 | 359.0 |
| Murder | 4 | 19.0 | 8.7 | 5.0 |
| Robbery | 18 | 85.5 | 34.0 | 61.0 |
| Aggravated Assault | 140 | 665.0 | 291.4 | 256.0 |
| Property Crime | 919 | 4,365.4 | 1,565.1 | 1,760.0 |
| Burglary | 214 | 1,016.5 | 243.5 | 229.0 |
| Larceny | 612 | 2,907.1 | 1,148.5 | 1,272.0 |
| Car Theft | 93 | 441.8 | 173.0 | 259.0 |
Source: FBI Uniform Crime Reporting (2024)
Cost of living in Anniston summary. We use data on the cost of living to determine how expensive it is to live in Anniston. Real estate prices drive most of the variance in cost of living around Alabama. Key points include:
The cost of living in Anniston is 89 with 100 being average.
The cost of living in Anniston is 0.9x lower than the national average.
The median home value in Anniston is $147,195.
The median income in Anniston is $46,668.
Anniston's Overall Cost Of Living
Lower Than The National Average
Cost Of Living In Anniston Comparison Table
| Living Expense | Anniston | Alabama | National Average |
|---|---|---|---|
| Overall | 89 | 91 | 100 |
| Services | 96 | 95 | 100 |
| Groceries | 93 | 96 | 100 |
| Health | 71 | 74 | 100 |
| Housing | 91 | 96 | 100 |
| Transportation | 98 | 95 | 100 |
| Utilities | 92 | 95 | 100 |
Source: Cost of living index, normalized to US average = 100
Anniston, AL Weather
The average high in Anniston is 72.7° and the average low is 49.2°.
There are 76.3 days of precipitation each year.
Expect an average of 52.4 inches of precipitation each year with 1.0 inches of snow.
| Stat | Anniston |
|---|---|
| Average Annual High | 72.7 |
| Average Annual Low | 49.2 |
| Annual Precipitation Days | 76.3 |
| Average Annual Precipitation | 52.4 |
| Average Annual Snowfall | 1.0 |
Average High
Days of Rain
Source: NOAA climate normals (30-year)
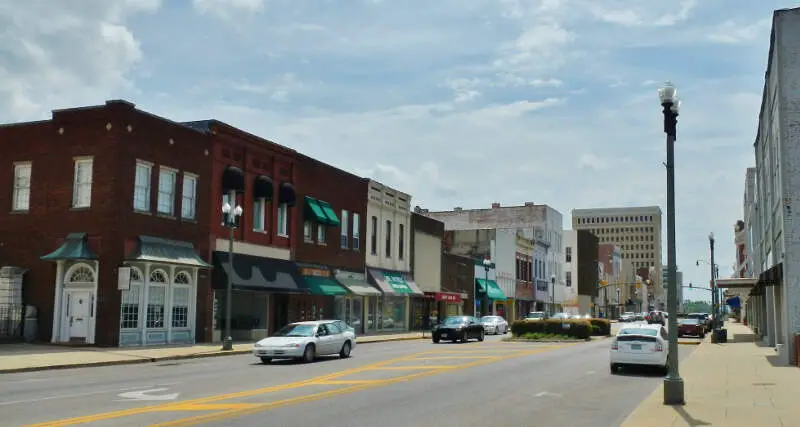
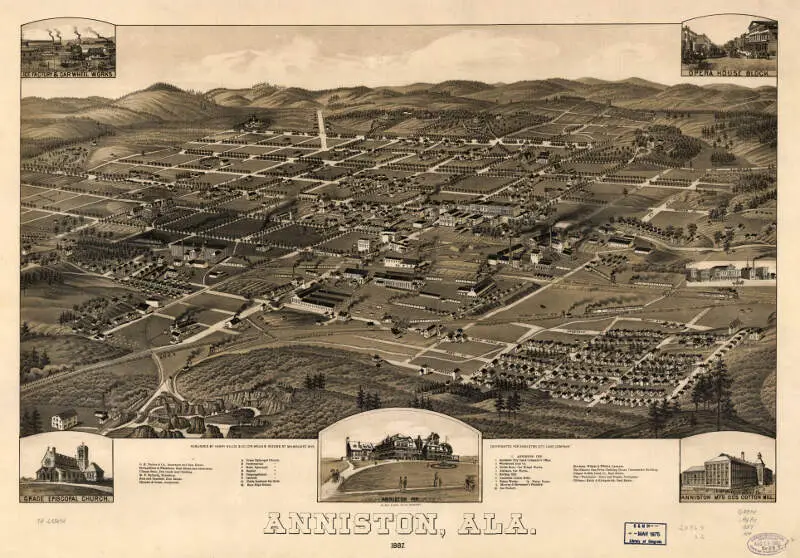
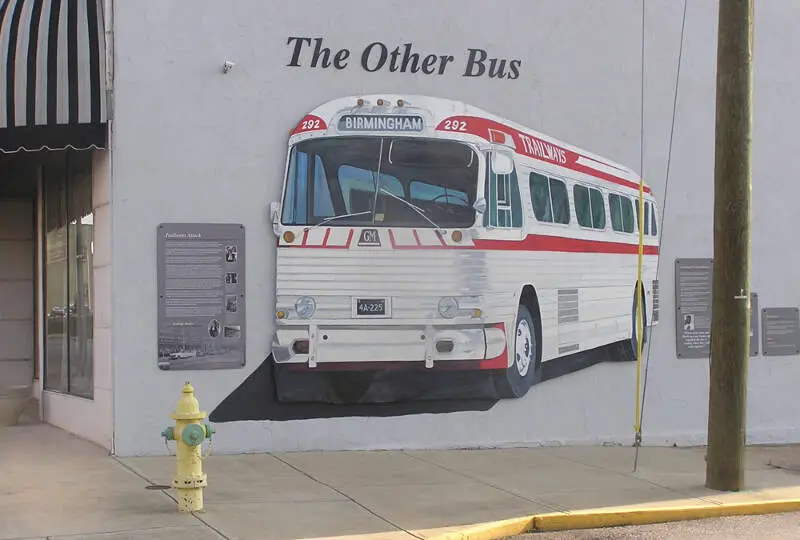
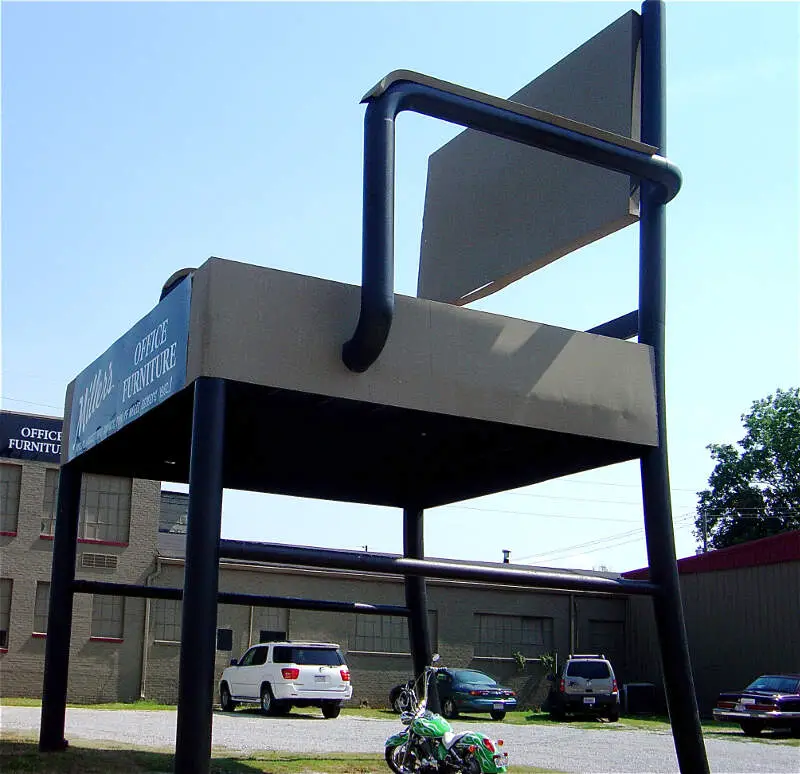
Anniston, AL Photos

1 Reviews & Comments About Anniston

I live in Anniston and every house is not vacant and everyone makes good money from doctors to the depot
Rankings & Articles For Anniston


Locations Around Anniston
Map Of Anniston, AL
Best Places Around Anniston
Bremen, GA
Population 7,488
Cedartown, GA
Population 10,227
Gadsden, AL
Population 33,374
Talladega, AL
Population 14,760
Sylacauga, AL
Population 12,309
Jacksonville, AL
Population 14,437
Saks, AL
Population 10,681
Irondale, AL
Population 13,464
Moody, AL
Population 13,488
Oxford, AL
Population 22,063
Anniston Demographics And Statistics
Population over time in Anniston
The current population in Anniston is 21,271. The population has decreased 8.7% from 2010.
| Year | Population | % Change |
|---|---|---|
| 2024 | 21,271 | -0.5% |
| 2023 | 21,377 | -0.6% |
| 2022 | 21,502 | 0.2% |
| 2021 | 21,455 | -0.3% |
| 2020 | 21,518 | -0.8% |
| 2019 | 21,688 | -1.1% |
| 2018 | 21,924 | -0.8% |
| 2017 | 22,097 | -1.5% |
| 2016 | 22,441 | -0.8% |
| 2015 | 22,626 | -0.5% |
| 2014 | 22,749 | -0.9% |
| 2013 | 22,947 | -0.5% |
| 2012 | 23,067 | -0.5% |
| 2011 | 23,189 | -0.5% |
| 2010 | 23,297 | - |
Race / Ethnicity in Anniston
See the full breakdown
Anniston is:
41.5% White with 8,824 White residents.
50.5% African American with 10,732 African American residents.
0.3% American Indian with 70 American Indian residents.
0.4% Asian with 77 Asian residents.
0.0% Hawaiian with 0 Hawaiian residents.
0.6% Other with 134 Other residents.
2.6% Two Or More with 547 Two Or More residents.
4.2% Hispanic with 887 Hispanic residents.
| Race | Anniston | AL | USA |
|---|---|---|---|
| White | 41.5% | 63.4% | 57.4% |
| African American | 50.5% | 25.6% | 11.9% |
| American Indian | 0.3% | 0.3% | 0.5% |
| Asian | 0.4% | 1.4% | 5.9% |
| Hawaiian | 0.0% | 0.0% | 0.2% |
| Other | 0.6% | 0.4% | 0.6% |
| Two Or More | 2.6% | 3.3% | 4.3% |
| Hispanic | 4.2% | 5.6% | 19.3% |
Gender in Anniston
See the full breakdown
Anniston is 51.9% female with 11,049 female residents.
Anniston is 48.1% male with 10,222 male residents.
| Gender | Anniston | AL | USA |
|---|---|---|---|
| Female | 51.9% | 51.4% | 50.5% |
| Male | 48.1% | 48.6% | 49.5% |
Highest level of educational attainment in Anniston for adults over 25
See the full breakdown
3.0% of adults in Anniston completed < 9th grade.
12.0% of adults in Anniston completed 9-12th grade.
33.0% of adults in Anniston completed high school / ged.
25.0% of adults in Anniston completed some college.
6.0% of adults in Anniston completed associate's degree.
13.0% of adults in Anniston completed bachelor's degree.
5.0% of adults in Anniston completed master's degree.
2.0% of adults in Anniston completed professional degree.
1.0% of adults in Anniston completed doctorate degree.
| Education | Anniston | AL | USA |
|---|---|---|---|
| < 9th Grade | 3.0% | 4.0% | 4.0% |
| 9-12th Grade | 12.0% | 8.0% | 6.0% |
| High School / GED | 33.0% | 30.0% | 26.0% |
| Some College | 25.0% | 21.0% | 19.0% |
| Associate's Degree | 6.0% | 9.0% | 9.0% |
| Bachelor's Degree | 13.0% | 17.0% | 22.0% |
| Master's Degree | 5.0% | 8.0% | 10.0% |
| Professional Degree | 2.0% | 2.0% | 2.0% |
| Doctorate Degree | 1.0% | 1.0% | 2.0% |
Household Income For Anniston, Alabama
See the full breakdown
10.1% of households in Anniston earn Less than $10,000.
8.2% of households in Anniston earn $10,000 to $14,999.
11.5% of households in Anniston earn $15,000 to $24,999.
10.7% of households in Anniston earn $25,000 to $34,999.
12.3% of households in Anniston earn $35,000 to $49,999.
15.2% of households in Anniston earn $50,000 to $74,999.
11.2% of households in Anniston earn $75,000 to $99,999.
12.3% of households in Anniston earn $100,000 to $149,999.
3.6% of households in Anniston earn $150,000 to $199,999.
5.0% of households in Anniston earn $200,000 or more.
| Income | Anniston | AL | USA |
|---|---|---|---|
| Less than $10,000 | 10.1% | 6.3% | 5.0% |
| $10,000 to $14,999 | 8.2% | 4.7% | 3.4% |
| $15,000 to $24,999 | 11.5% | 8.8% | 6.3% |
| $25,000 to $34,999 | 10.7% | 8.5% | 6.6% |
| $35,000 to $49,999 | 12.3% | 11.8% | 10.1% |
| $50,000 to $74,999 | 15.2% | 16.7% | 15.5% |
| $75,000 to $99,999 | 11.2% | 12.7% | 12.6% |
| $100,000 to $149,999 | 12.3% | 15.5% | 17.5% |
| $150,000 to $199,999 | 3.6% | 7.4% | 9.6% |
| $200,000 or more | 5.0% | 7.8% | 13.4% |
Source: U.S. Census ACS 5-year estimates (2024)


